Ghanaian vs Immigrants from Western Africa Family Households
COMPARE
Ghanaian
Immigrants from Western Africa
Family Households
Family Households Comparison
Ghanaians
Immigrants from Western Africa
63.5%
FAMILY HOUSEHOLDS
2.1/ 100
METRIC RATING
236th/ 347
METRIC RANK
63.1%
FAMILY HOUSEHOLDS
0.5/ 100
METRIC RATING
266th/ 347
METRIC RANK
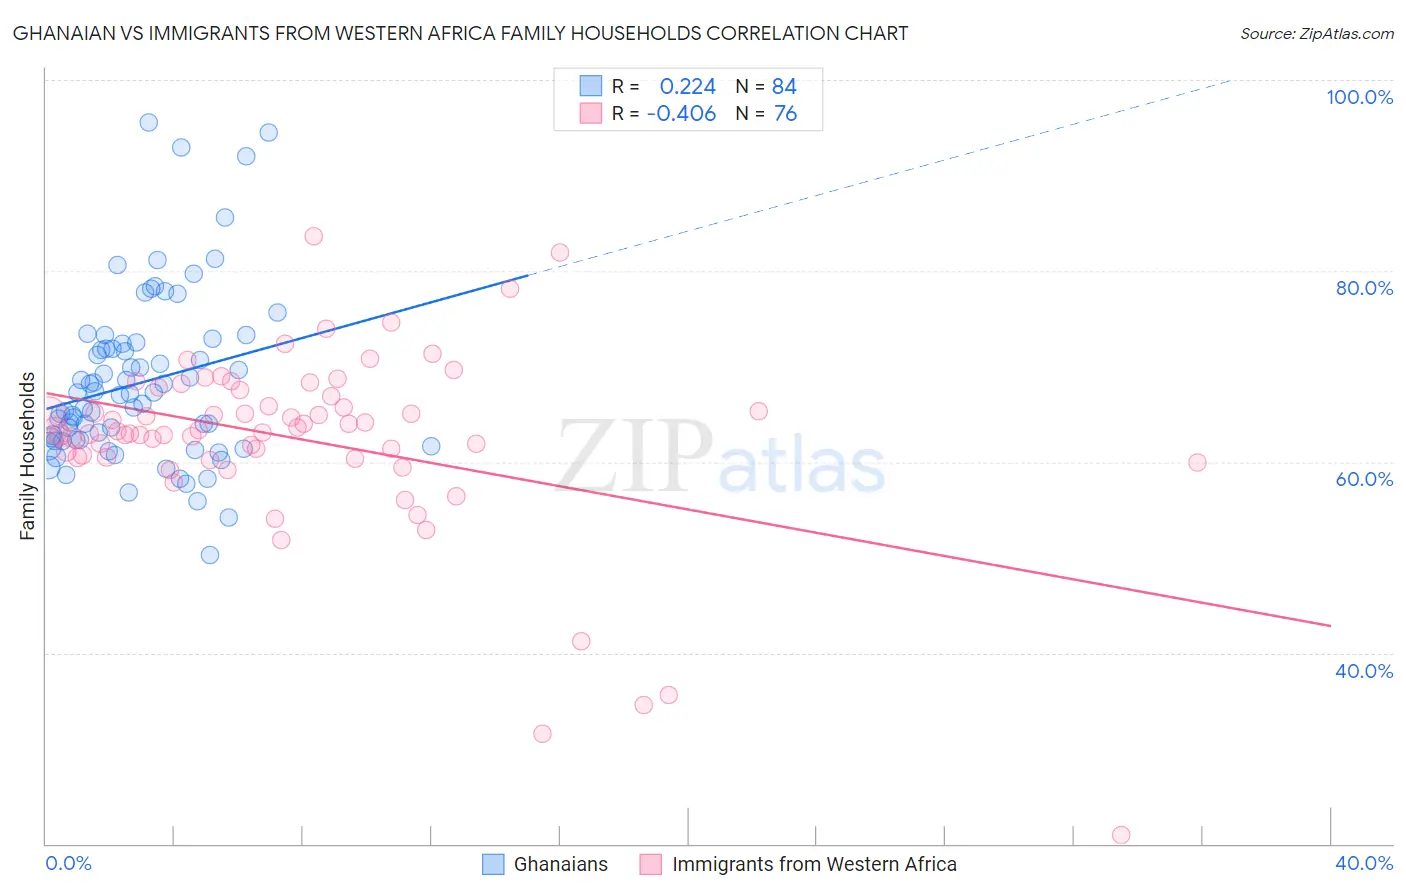
Ghanaian vs Immigrants from Western Africa Family Households Correlation Chart
The statistical analysis conducted on geographies consisting of 190,523,422 people shows a weak positive correlation between the proportion of Ghanaians and percentage of family households in the United States with a correlation coefficient (R) of 0.224 and weighted average of 63.5%. Similarly, the statistical analysis conducted on geographies consisting of 357,554,747 people shows a moderate negative correlation between the proportion of Immigrants from Western Africa and percentage of family households in the United States with a correlation coefficient (R) of -0.406 and weighted average of 63.1%, a difference of 0.51%.
Family Households Correlation Summary
| Measurement | Ghanaian | Immigrants from Western Africa |
| Minimum | 50.2% | 20.9% |
| Maximum | 95.6% | 83.6% |
| Range | 45.4% | 62.7% |
| Mean | 68.3% | 62.4% |
| Median | 67.1% | 63.3% |
| Interquartile 25% (IQ1) | 62.3% | 60.5% |
| Interquartile 75% (IQ3) | 72.1% | 67.2% |
| Interquartile Range (IQR) | 9.9% | 6.7% |
| Standard Deviation (Sample) | 8.9% | 9.9% |
| Standard Deviation (Population) | 8.8% | 9.8% |
Similar Demographics by Family Households
Demographics Similar to Ghanaians by Family Households
In terms of family households, the demographic groups most similar to Ghanaians are Comanche (63.5%, a difference of 0.0%), Albanian (63.5%, a difference of 0.010%), Immigrants from Zimbabwe (63.5%, a difference of 0.010%), Finnish (63.5%, a difference of 0.040%), and Aleut (63.4%, a difference of 0.040%).
| Demographics | Rating | Rank | Family Households |
| Bulgarians | 3.4 /100 | #229 | Tragic 63.6% |
| Immigrants | Brazil | 3.0 /100 | #230 | Tragic 63.6% |
| Immigrants | Greece | 2.9 /100 | #231 | Tragic 63.5% |
| Immigrants | Northern Africa | 2.6 /100 | #232 | Tragic 63.5% |
| Immigrants | Armenia | 2.6 /100 | #233 | Tragic 63.5% |
| Finns | 2.3 /100 | #234 | Tragic 63.5% |
| Albanians | 2.2 /100 | #235 | Tragic 63.5% |
| Ghanaians | 2.1 /100 | #236 | Tragic 63.5% |
| Comanche | 2.1 /100 | #237 | Tragic 63.5% |
| Immigrants | Zimbabwe | 2.0 /100 | #238 | Tragic 63.5% |
| Aleuts | 1.9 /100 | #239 | Tragic 63.4% |
| South Africans | 1.9 /100 | #240 | Tragic 63.4% |
| Immigrants | St. Vincent and the Grenadines | 1.9 /100 | #241 | Tragic 63.4% |
| Immigrants | Israel | 1.8 /100 | #242 | Tragic 63.4% |
| Immigrants | Czechoslovakia | 1.8 /100 | #243 | Tragic 63.4% |
Demographics Similar to Immigrants from Western Africa by Family Households
In terms of family households, the demographic groups most similar to Immigrants from Western Africa are Colville (63.2%, a difference of 0.010%), Cheyenne (63.2%, a difference of 0.020%), Kenyan (63.2%, a difference of 0.020%), Israeli (63.1%, a difference of 0.040%), and Immigrants from Ireland (63.2%, a difference of 0.050%).
| Demographics | Rating | Rank | Family Households |
| Immigrants | Western Europe | 0.6 /100 | #259 | Tragic 63.2% |
| Cypriots | 0.6 /100 | #260 | Tragic 63.2% |
| Immigrants | Russia | 0.6 /100 | #261 | Tragic 63.2% |
| Immigrants | Ireland | 0.6 /100 | #262 | Tragic 63.2% |
| Cheyenne | 0.5 /100 | #263 | Tragic 63.2% |
| Kenyans | 0.5 /100 | #264 | Tragic 63.2% |
| Colville | 0.5 /100 | #265 | Tragic 63.2% |
| Immigrants | Western Africa | 0.5 /100 | #266 | Tragic 63.1% |
| Israelis | 0.4 /100 | #267 | Tragic 63.1% |
| Immigrants | Singapore | 0.4 /100 | #268 | Tragic 63.1% |
| Yugoslavians | 0.4 /100 | #269 | Tragic 63.1% |
| Immigrants | Austria | 0.3 /100 | #270 | Tragic 63.1% |
| Immigrants | Croatia | 0.3 /100 | #271 | Tragic 63.1% |
| Immigrants | Turkey | 0.3 /100 | #272 | Tragic 63.1% |
| Immigrants | Kazakhstan | 0.3 /100 | #273 | Tragic 63.1% |