Indonesian vs Apache Family Households
COMPARE
Indonesian
Apache
Family Households
Family Households Comparison
Indonesians
Apache
61.5%
FAMILY HOUSEHOLDS
0.0/ 100
METRIC RATING
326th/ 347
METRIC RANK
66.5%
FAMILY HOUSEHOLDS
100.0/ 100
METRIC RATING
43rd/ 347
METRIC RANK
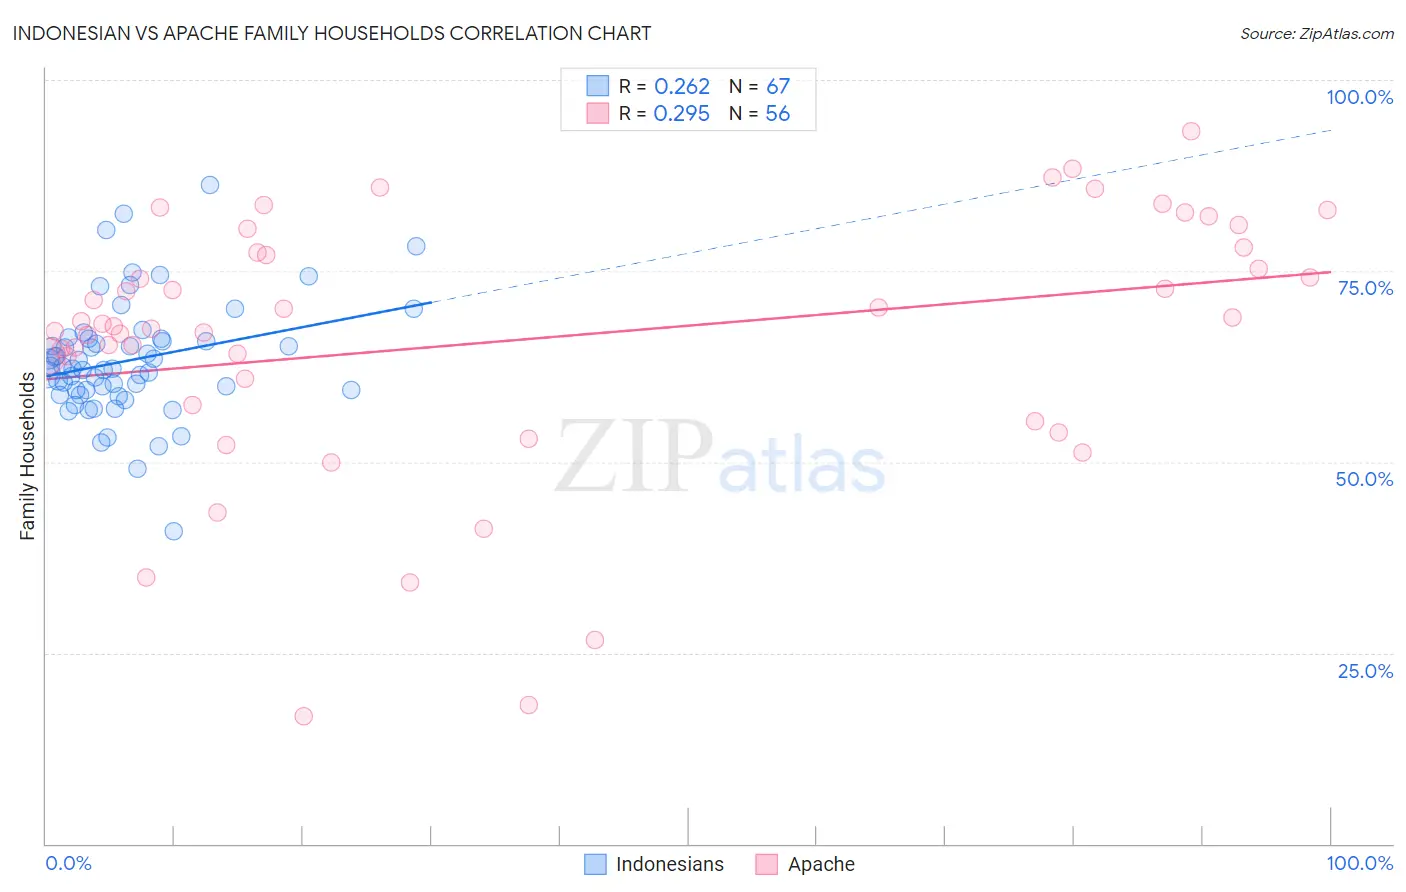
Indonesian vs Apache Family Households Correlation Chart
The statistical analysis conducted on geographies consisting of 162,647,758 people shows a weak positive correlation between the proportion of Indonesians and percentage of family households in the United States with a correlation coefficient (R) of 0.262 and weighted average of 61.5%. Similarly, the statistical analysis conducted on geographies consisting of 231,040,944 people shows a weak positive correlation between the proportion of Apache and percentage of family households in the United States with a correlation coefficient (R) of 0.295 and weighted average of 66.5%, a difference of 8.2%.
Family Households Correlation Summary
| Measurement | Indonesian | Apache |
| Minimum | 40.9% | 16.7% |
| Maximum | 86.2% | 93.2% |
| Range | 45.3% | 76.6% |
| Mean | 63.3% | 66.0% |
| Median | 62.3% | 67.9% |
| Interquartile 25% (IQ1) | 59.4% | 59.1% |
| Interquartile 75% (IQ3) | 66.1% | 77.7% |
| Interquartile Range (IQR) | 6.7% | 18.6% |
| Standard Deviation (Sample) | 7.6% | 17.1% |
| Standard Deviation (Population) | 7.6% | 16.9% |
Similar Demographics by Family Households
Demographics Similar to Indonesians by Family Households
In terms of family households, the demographic groups most similar to Indonesians are Black/African American (61.5%, a difference of 0.020%), Kiowa (61.4%, a difference of 0.15%), Cambodian (61.4%, a difference of 0.18%), Immigrants from Switzerland (61.6%, a difference of 0.19%), and Immigrants from West Indies (61.6%, a difference of 0.20%).
| Demographics | Rating | Rank | Family Households |
| Cape Verdeans | 0.0 /100 | #319 | Tragic 61.8% |
| Ugandans | 0.0 /100 | #320 | Tragic 61.7% |
| Alsatians | 0.0 /100 | #321 | Tragic 61.7% |
| Immigrants | Serbia | 0.0 /100 | #322 | Tragic 61.6% |
| Tlingit-Haida | 0.0 /100 | #323 | Tragic 61.6% |
| Immigrants | West Indies | 0.0 /100 | #324 | Tragic 61.6% |
| Immigrants | Switzerland | 0.0 /100 | #325 | Tragic 61.6% |
| Indonesians | 0.0 /100 | #326 | Tragic 61.5% |
| Blacks/African Americans | 0.0 /100 | #327 | Tragic 61.5% |
| Kiowa | 0.0 /100 | #328 | Tragic 61.4% |
| Cambodians | 0.0 /100 | #329 | Tragic 61.4% |
| Immigrants | Australia | 0.0 /100 | #330 | Tragic 61.3% |
| Immigrants | France | 0.0 /100 | #331 | Tragic 61.3% |
| Ethiopians | 0.0 /100 | #332 | Tragic 61.2% |
| Immigrants | Ethiopia | 0.0 /100 | #333 | Tragic 61.2% |
Demographics Similar to Apache by Family Households
In terms of family households, the demographic groups most similar to Apache are Menominee (66.5%, a difference of 0.010%), Asian (66.5%, a difference of 0.050%), Immigrants from Bolivia (66.6%, a difference of 0.070%), Venezuelan (66.5%, a difference of 0.070%), and Arapaho (66.5%, a difference of 0.090%).
| Demographics | Rating | Rank | Family Households |
| Peruvians | 100.0 /100 | #36 | Exceptional 67.1% |
| Tsimshian | 100.0 /100 | #37 | Exceptional 67.1% |
| Mexican American Indians | 100.0 /100 | #38 | Exceptional 67.0% |
| Immigrants | El Salvador | 100.0 /100 | #39 | Exceptional 67.0% |
| Guamanians/Chamorros | 100.0 /100 | #40 | Exceptional 66.6% |
| Immigrants | Bolivia | 100.0 /100 | #41 | Exceptional 66.6% |
| Menominee | 100.0 /100 | #42 | Exceptional 66.5% |
| Apache | 100.0 /100 | #43 | Exceptional 66.5% |
| Asians | 100.0 /100 | #44 | Exceptional 66.5% |
| Venezuelans | 100.0 /100 | #45 | Exceptional 66.5% |
| Arapaho | 100.0 /100 | #46 | Exceptional 66.5% |
| Bolivians | 100.0 /100 | #47 | Exceptional 66.5% |
| Immigrants | Venezuela | 100.0 /100 | #48 | Exceptional 66.4% |
| Immigrants | South Central Asia | 100.0 /100 | #49 | Exceptional 66.4% |
| Navajo | 100.0 /100 | #50 | Exceptional 66.4% |