Italian vs Apache Family Households
COMPARE
Italian
Apache
Family Households
Family Households Comparison
Italians
Apache
64.8%
FAMILY HOUSEHOLDS
91.9/ 100
METRIC RATING
128th/ 347
METRIC RANK
66.5%
FAMILY HOUSEHOLDS
100.0/ 100
METRIC RATING
43rd/ 347
METRIC RANK
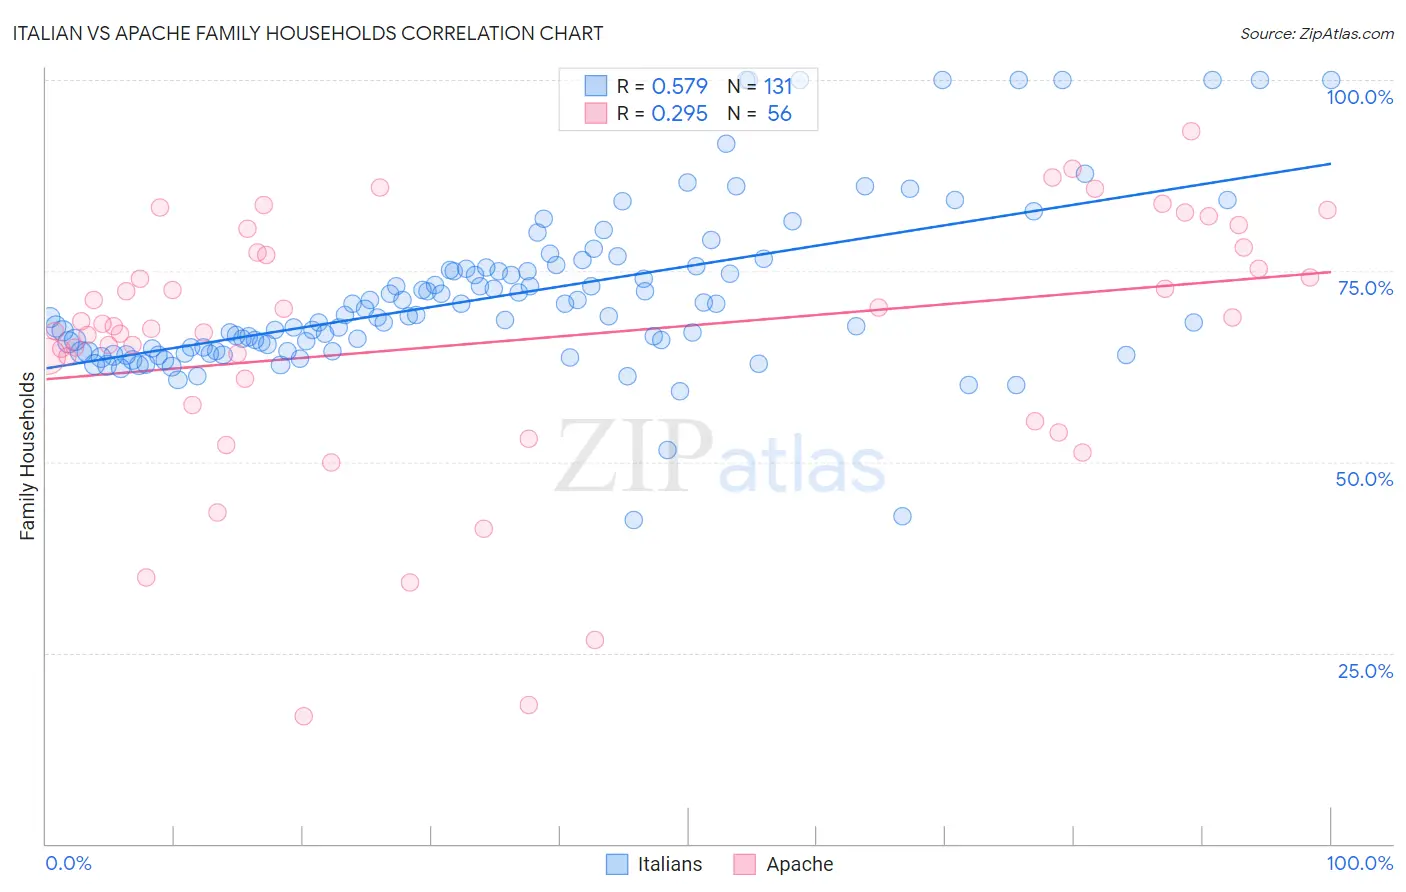
Italian vs Apache Family Households Correlation Chart
The statistical analysis conducted on geographies consisting of 574,452,488 people shows a substantial positive correlation between the proportion of Italians and percentage of family households in the United States with a correlation coefficient (R) of 0.579 and weighted average of 64.8%. Similarly, the statistical analysis conducted on geographies consisting of 231,040,944 people shows a weak positive correlation between the proportion of Apache and percentage of family households in the United States with a correlation coefficient (R) of 0.295 and weighted average of 66.5%, a difference of 2.6%.
Family Households Correlation Summary
| Measurement | Italian | Apache |
| Minimum | 42.4% | 16.7% |
| Maximum | 100.0% | 93.2% |
| Range | 57.6% | 76.6% |
| Mean | 71.7% | 66.0% |
| Median | 69.1% | 67.9% |
| Interquartile 25% (IQ1) | 64.5% | 59.1% |
| Interquartile 75% (IQ3) | 75.2% | 77.7% |
| Interquartile Range (IQR) | 10.7% | 18.6% |
| Standard Deviation (Sample) | 10.9% | 17.1% |
| Standard Deviation (Population) | 10.8% | 16.9% |
Similar Demographics by Family Households
Demographics Similar to Italians by Family Households
In terms of family households, the demographic groups most similar to Italians are Immigrants from Panama (64.8%, a difference of 0.010%), Panamanian (64.8%, a difference of 0.020%), Immigrants from Ecuador (64.8%, a difference of 0.020%), Immigrants from Argentina (64.9%, a difference of 0.040%), and Immigrants from Belize (64.9%, a difference of 0.040%).
| Demographics | Rating | Rank | Family Households |
| Hungarians | 94.0 /100 | #121 | Exceptional 64.9% |
| Hmong | 93.4 /100 | #122 | Exceptional 64.9% |
| Choctaw | 93.4 /100 | #123 | Exceptional 64.9% |
| Immigrants | Argentina | 92.8 /100 | #124 | Exceptional 64.9% |
| Immigrants | Belize | 92.7 /100 | #125 | Exceptional 64.9% |
| Panamanians | 92.4 /100 | #126 | Exceptional 64.8% |
| Immigrants | Panama | 92.0 /100 | #127 | Exceptional 64.8% |
| Italians | 91.9 /100 | #128 | Exceptional 64.8% |
| Immigrants | Ecuador | 91.4 /100 | #129 | Exceptional 64.8% |
| Immigrants | Italy | 90.2 /100 | #130 | Exceptional 64.8% |
| Immigrants | Nonimmigrants | 90.1 /100 | #131 | Exceptional 64.8% |
| Cajuns | 89.4 /100 | #132 | Excellent 64.8% |
| Belizeans | 89.3 /100 | #133 | Excellent 64.8% |
| Greeks | 88.1 /100 | #134 | Excellent 64.7% |
| Maltese | 87.4 /100 | #135 | Excellent 64.7% |
Demographics Similar to Apache by Family Households
In terms of family households, the demographic groups most similar to Apache are Menominee (66.5%, a difference of 0.010%), Asian (66.5%, a difference of 0.050%), Immigrants from Bolivia (66.6%, a difference of 0.070%), Venezuelan (66.5%, a difference of 0.070%), and Arapaho (66.5%, a difference of 0.090%).
| Demographics | Rating | Rank | Family Households |
| Peruvians | 100.0 /100 | #36 | Exceptional 67.1% |
| Tsimshian | 100.0 /100 | #37 | Exceptional 67.1% |
| Mexican American Indians | 100.0 /100 | #38 | Exceptional 67.0% |
| Immigrants | El Salvador | 100.0 /100 | #39 | Exceptional 67.0% |
| Guamanians/Chamorros | 100.0 /100 | #40 | Exceptional 66.6% |
| Immigrants | Bolivia | 100.0 /100 | #41 | Exceptional 66.6% |
| Menominee | 100.0 /100 | #42 | Exceptional 66.5% |
| Apache | 100.0 /100 | #43 | Exceptional 66.5% |
| Asians | 100.0 /100 | #44 | Exceptional 66.5% |
| Venezuelans | 100.0 /100 | #45 | Exceptional 66.5% |
| Arapaho | 100.0 /100 | #46 | Exceptional 66.5% |
| Bolivians | 100.0 /100 | #47 | Exceptional 66.5% |
| Immigrants | Venezuela | 100.0 /100 | #48 | Exceptional 66.4% |
| Immigrants | South Central Asia | 100.0 /100 | #49 | Exceptional 66.4% |
| Navajo | 100.0 /100 | #50 | Exceptional 66.4% |