French American Indian vs Apache Family Households
COMPARE
French American Indian
Apache
Family Households
Family Households Comparison
French American Indians
Apache
62.4%
FAMILY HOUSEHOLDS
0.0/ 100
METRIC RATING
297th/ 347
METRIC RANK
66.5%
FAMILY HOUSEHOLDS
100.0/ 100
METRIC RATING
43rd/ 347
METRIC RANK
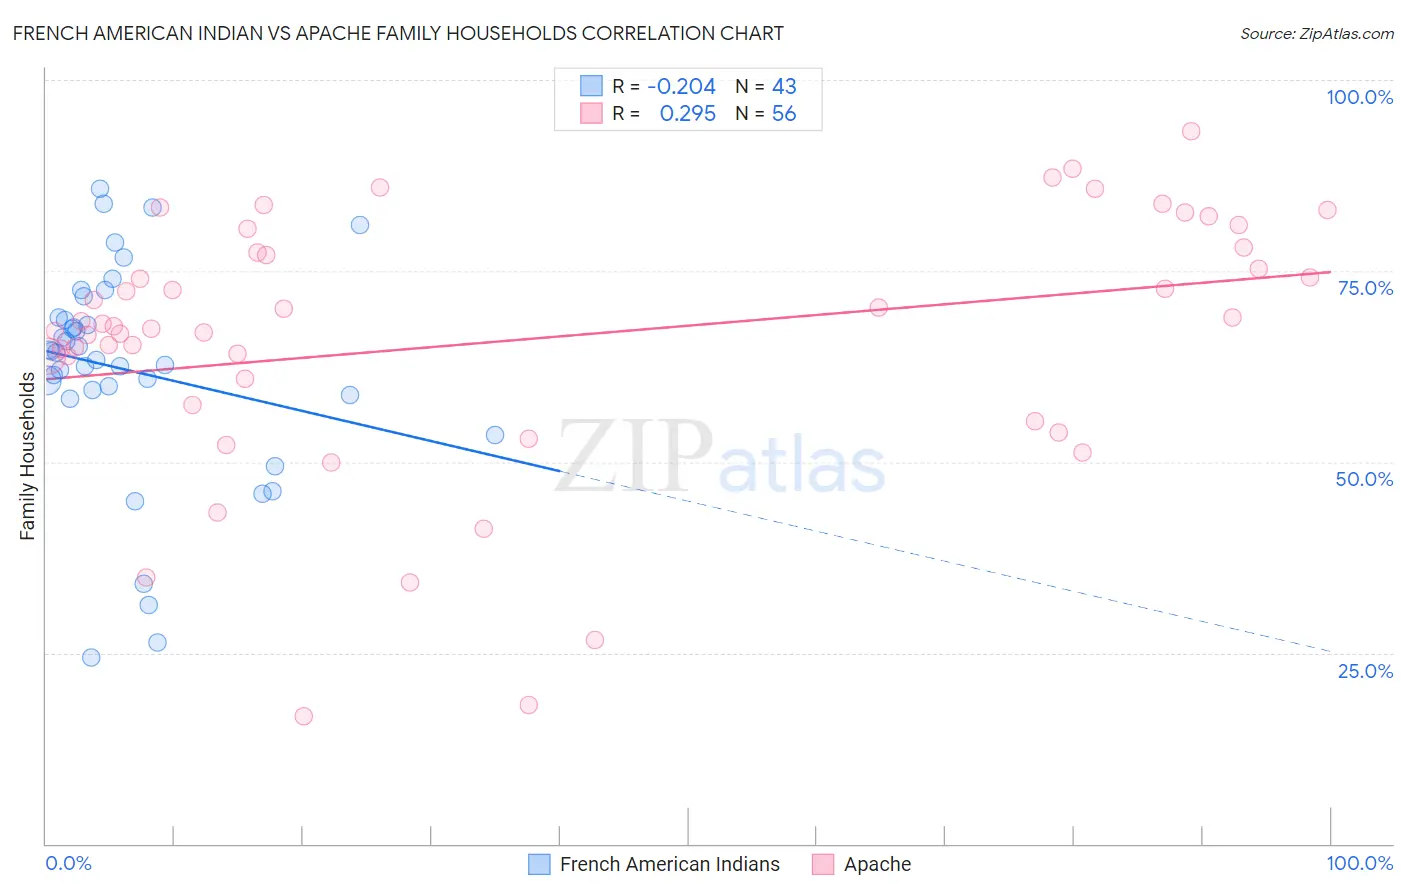
French American Indian vs Apache Family Households Correlation Chart
The statistical analysis conducted on geographies consisting of 131,961,185 people shows a weak negative correlation between the proportion of French American Indians and percentage of family households in the United States with a correlation coefficient (R) of -0.204 and weighted average of 62.4%. Similarly, the statistical analysis conducted on geographies consisting of 231,040,944 people shows a weak positive correlation between the proportion of Apache and percentage of family households in the United States with a correlation coefficient (R) of 0.295 and weighted average of 66.5%, a difference of 6.6%.
Family Households Correlation Summary
| Measurement | French American Indian | Apache |
| Minimum | 24.4% | 16.7% |
| Maximum | 85.7% | 93.2% |
| Range | 61.3% | 76.6% |
| Mean | 62.0% | 66.0% |
| Median | 64.2% | 67.9% |
| Interquartile 25% (IQ1) | 58.8% | 59.1% |
| Interquartile 75% (IQ3) | 68.8% | 77.7% |
| Interquartile Range (IQR) | 10.1% | 18.6% |
| Standard Deviation (Sample) | 14.3% | 17.1% |
| Standard Deviation (Population) | 14.1% | 16.9% |
Similar Demographics by Family Households
Demographics Similar to French American Indians by Family Households
In terms of family households, the demographic groups most similar to French American Indians are Slovene (62.4%, a difference of 0.010%), Okinawan (62.5%, a difference of 0.020%), Immigrants from Spain (62.4%, a difference of 0.030%), Barbadian (62.5%, a difference of 0.040%), and Immigrants from Kuwait (62.4%, a difference of 0.090%).
| Demographics | Rating | Rank | Family Households |
| Immigrants | Grenada | 0.0 /100 | #290 | Tragic 62.6% |
| U.S. Virgin Islanders | 0.0 /100 | #291 | Tragic 62.6% |
| Immigrants | Burma/Myanmar | 0.0 /100 | #292 | Tragic 62.6% |
| Immigrants | Sweden | 0.0 /100 | #293 | Tragic 62.5% |
| Barbadians | 0.0 /100 | #294 | Tragic 62.5% |
| Okinawans | 0.0 /100 | #295 | Tragic 62.5% |
| Slovenes | 0.0 /100 | #296 | Tragic 62.4% |
| French American Indians | 0.0 /100 | #297 | Tragic 62.4% |
| Immigrants | Spain | 0.0 /100 | #298 | Tragic 62.4% |
| Immigrants | Kuwait | 0.0 /100 | #299 | Tragic 62.4% |
| Immigrants | Africa | 0.0 /100 | #300 | Tragic 62.4% |
| Immigrants | Albania | 0.0 /100 | #301 | Tragic 62.4% |
| Immigrants | Kenya | 0.0 /100 | #302 | Tragic 62.3% |
| Cree | 0.0 /100 | #303 | Tragic 62.3% |
| Iroquois | 0.0 /100 | #304 | Tragic 62.2% |
Demographics Similar to Apache by Family Households
In terms of family households, the demographic groups most similar to Apache are Menominee (66.5%, a difference of 0.010%), Asian (66.5%, a difference of 0.050%), Immigrants from Bolivia (66.6%, a difference of 0.070%), Venezuelan (66.5%, a difference of 0.070%), and Arapaho (66.5%, a difference of 0.090%).
| Demographics | Rating | Rank | Family Households |
| Peruvians | 100.0 /100 | #36 | Exceptional 67.1% |
| Tsimshian | 100.0 /100 | #37 | Exceptional 67.1% |
| Mexican American Indians | 100.0 /100 | #38 | Exceptional 67.0% |
| Immigrants | El Salvador | 100.0 /100 | #39 | Exceptional 67.0% |
| Guamanians/Chamorros | 100.0 /100 | #40 | Exceptional 66.6% |
| Immigrants | Bolivia | 100.0 /100 | #41 | Exceptional 66.6% |
| Menominee | 100.0 /100 | #42 | Exceptional 66.5% |
| Apache | 100.0 /100 | #43 | Exceptional 66.5% |
| Asians | 100.0 /100 | #44 | Exceptional 66.5% |
| Venezuelans | 100.0 /100 | #45 | Exceptional 66.5% |
| Arapaho | 100.0 /100 | #46 | Exceptional 66.5% |
| Bolivians | 100.0 /100 | #47 | Exceptional 66.5% |
| Immigrants | Venezuela | 100.0 /100 | #48 | Exceptional 66.4% |
| Immigrants | South Central Asia | 100.0 /100 | #49 | Exceptional 66.4% |
| Navajo | 100.0 /100 | #50 | Exceptional 66.4% |