Ghanaian vs Immigrants from Sweden Family Households
COMPARE
Ghanaian
Immigrants from Sweden
Family Households
Family Households Comparison
Ghanaians
Immigrants from Sweden
63.5%
FAMILY HOUSEHOLDS
2.1/ 100
METRIC RATING
236th/ 347
METRIC RANK
62.5%
FAMILY HOUSEHOLDS
0.0/ 100
METRIC RATING
293rd/ 347
METRIC RANK
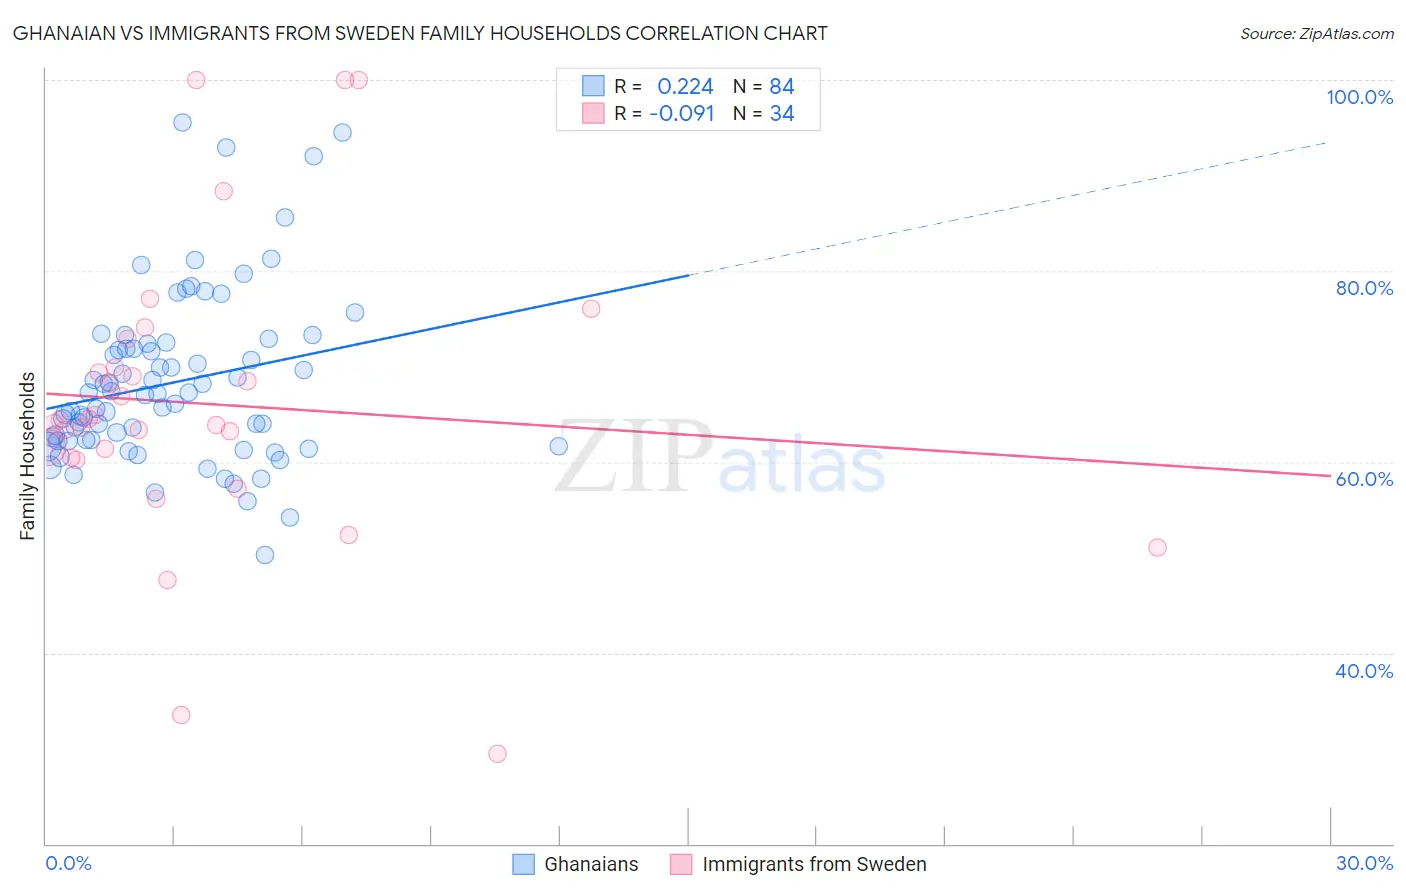
Ghanaian vs Immigrants from Sweden Family Households Correlation Chart
The statistical analysis conducted on geographies consisting of 190,523,422 people shows a weak positive correlation between the proportion of Ghanaians and percentage of family households in the United States with a correlation coefficient (R) of 0.224 and weighted average of 63.5%. Similarly, the statistical analysis conducted on geographies consisting of 164,705,416 people shows a slight negative correlation between the proportion of Immigrants from Sweden and percentage of family households in the United States with a correlation coefficient (R) of -0.091 and weighted average of 62.5%, a difference of 1.5%.
Family Households Correlation Summary
| Measurement | Ghanaian | Immigrants from Sweden |
| Minimum | 50.2% | 29.4% |
| Maximum | 95.6% | 100.0% |
| Range | 45.4% | 70.6% |
| Mean | 68.3% | 66.1% |
| Median | 67.1% | 64.2% |
| Interquartile 25% (IQ1) | 62.3% | 60.5% |
| Interquartile 75% (IQ3) | 72.1% | 69.9% |
| Interquartile Range (IQR) | 9.9% | 9.4% |
| Standard Deviation (Sample) | 8.9% | 15.4% |
| Standard Deviation (Population) | 8.8% | 15.2% |
Similar Demographics by Family Households
Demographics Similar to Ghanaians by Family Households
In terms of family households, the demographic groups most similar to Ghanaians are Comanche (63.5%, a difference of 0.0%), Albanian (63.5%, a difference of 0.010%), Immigrants from Zimbabwe (63.5%, a difference of 0.010%), Finnish (63.5%, a difference of 0.040%), and Aleut (63.4%, a difference of 0.040%).
| Demographics | Rating | Rank | Family Households |
| Bulgarians | 3.4 /100 | #229 | Tragic 63.6% |
| Immigrants | Brazil | 3.0 /100 | #230 | Tragic 63.6% |
| Immigrants | Greece | 2.9 /100 | #231 | Tragic 63.5% |
| Immigrants | Northern Africa | 2.6 /100 | #232 | Tragic 63.5% |
| Immigrants | Armenia | 2.6 /100 | #233 | Tragic 63.5% |
| Finns | 2.3 /100 | #234 | Tragic 63.5% |
| Albanians | 2.2 /100 | #235 | Tragic 63.5% |
| Ghanaians | 2.1 /100 | #236 | Tragic 63.5% |
| Comanche | 2.1 /100 | #237 | Tragic 63.5% |
| Immigrants | Zimbabwe | 2.0 /100 | #238 | Tragic 63.5% |
| Aleuts | 1.9 /100 | #239 | Tragic 63.4% |
| South Africans | 1.9 /100 | #240 | Tragic 63.4% |
| Immigrants | St. Vincent and the Grenadines | 1.9 /100 | #241 | Tragic 63.4% |
| Immigrants | Israel | 1.8 /100 | #242 | Tragic 63.4% |
| Immigrants | Czechoslovakia | 1.8 /100 | #243 | Tragic 63.4% |
Demographics Similar to Immigrants from Sweden by Family Households
In terms of family households, the demographic groups most similar to Immigrants from Sweden are Barbadian (62.5%, a difference of 0.060%), Okinawan (62.5%, a difference of 0.080%), Slovene (62.4%, a difference of 0.090%), French American Indian (62.4%, a difference of 0.10%), and Immigrants from Burma/Myanmar (62.6%, a difference of 0.13%).
| Demographics | Rating | Rank | Family Households |
| British West Indians | 0.1 /100 | #286 | Tragic 62.8% |
| Latvians | 0.1 /100 | #287 | Tragic 62.8% |
| Immigrants | Uganda | 0.1 /100 | #288 | Tragic 62.7% |
| Immigrants | Nepal | 0.1 /100 | #289 | Tragic 62.7% |
| Immigrants | Grenada | 0.0 /100 | #290 | Tragic 62.6% |
| U.S. Virgin Islanders | 0.0 /100 | #291 | Tragic 62.6% |
| Immigrants | Burma/Myanmar | 0.0 /100 | #292 | Tragic 62.6% |
| Immigrants | Sweden | 0.0 /100 | #293 | Tragic 62.5% |
| Barbadians | 0.0 /100 | #294 | Tragic 62.5% |
| Okinawans | 0.0 /100 | #295 | Tragic 62.5% |
| Slovenes | 0.0 /100 | #296 | Tragic 62.4% |
| French American Indians | 0.0 /100 | #297 | Tragic 62.4% |
| Immigrants | Spain | 0.0 /100 | #298 | Tragic 62.4% |
| Immigrants | Kuwait | 0.0 /100 | #299 | Tragic 62.4% |
| Immigrants | Africa | 0.0 /100 | #300 | Tragic 62.4% |