Ghanaian vs Immigrants from Sudan Family Households
COMPARE
Ghanaian
Immigrants from Sudan
Family Households
Family Households Comparison
Ghanaians
Immigrants from Sudan
63.5%
FAMILY HOUSEHOLDS
2.1/ 100
METRIC RATING
236th/ 347
METRIC RANK
60.2%
FAMILY HOUSEHOLDS
0.0/ 100
METRIC RATING
340th/ 347
METRIC RANK
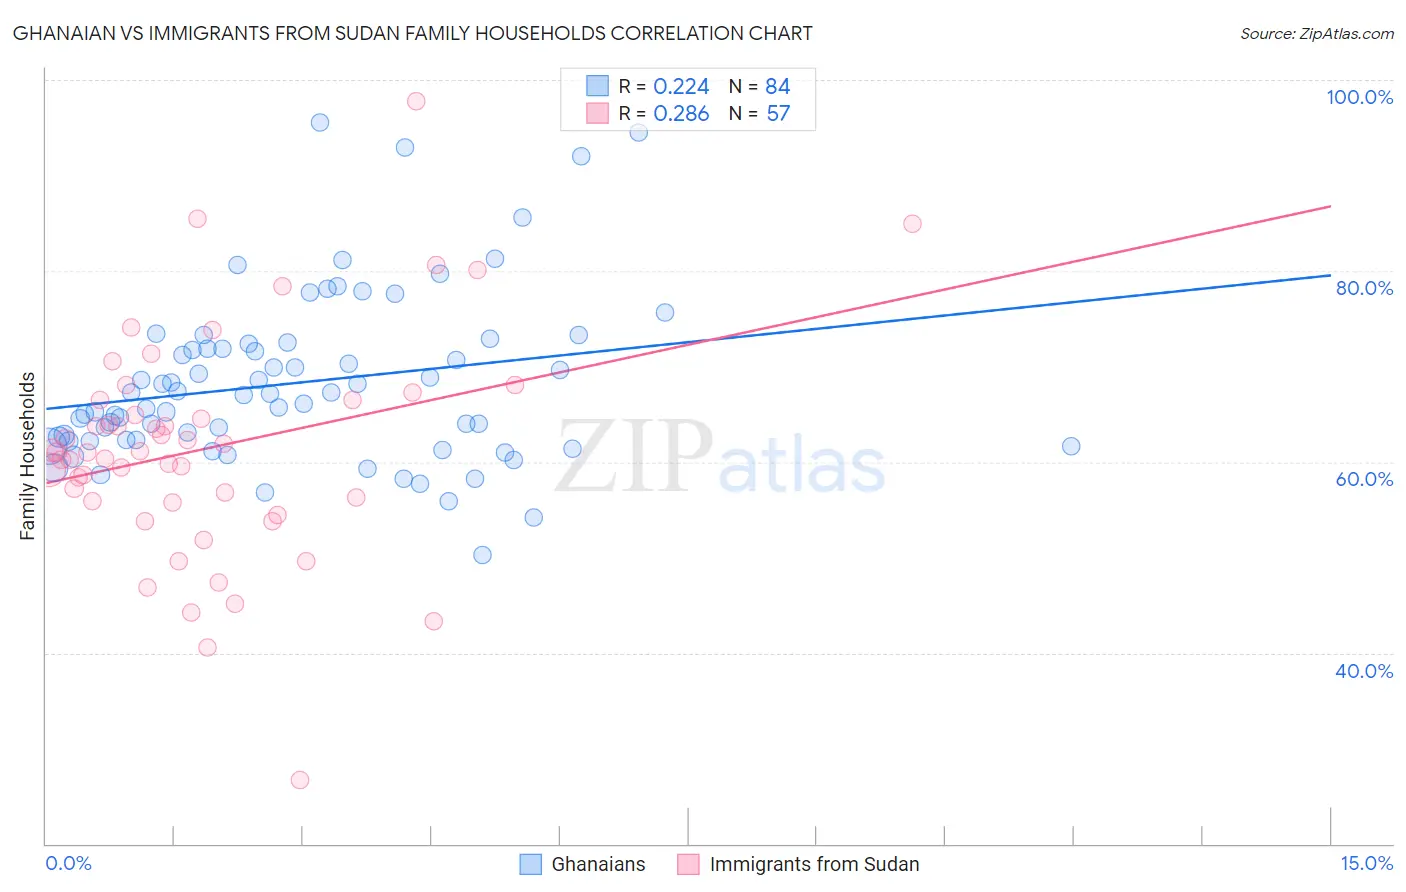
Ghanaian vs Immigrants from Sudan Family Households Correlation Chart
The statistical analysis conducted on geographies consisting of 190,523,422 people shows a weak positive correlation between the proportion of Ghanaians and percentage of family households in the United States with a correlation coefficient (R) of 0.224 and weighted average of 63.5%. Similarly, the statistical analysis conducted on geographies consisting of 118,943,916 people shows a weak positive correlation between the proportion of Immigrants from Sudan and percentage of family households in the United States with a correlation coefficient (R) of 0.286 and weighted average of 60.2%, a difference of 5.5%.
Family Households Correlation Summary
| Measurement | Ghanaian | Immigrants from Sudan |
| Minimum | 50.2% | 26.6% |
| Maximum | 95.6% | 97.8% |
| Range | 45.4% | 71.1% |
| Mean | 68.3% | 61.4% |
| Median | 67.1% | 61.0% |
| Interquartile 25% (IQ1) | 62.3% | 55.8% |
| Interquartile 75% (IQ3) | 72.1% | 66.4% |
| Interquartile Range (IQR) | 9.9% | 10.6% |
| Standard Deviation (Sample) | 8.9% | 11.8% |
| Standard Deviation (Population) | 8.8% | 11.7% |
Similar Demographics by Family Households
Demographics Similar to Ghanaians by Family Households
In terms of family households, the demographic groups most similar to Ghanaians are Comanche (63.5%, a difference of 0.0%), Albanian (63.5%, a difference of 0.010%), Immigrants from Zimbabwe (63.5%, a difference of 0.010%), Finnish (63.5%, a difference of 0.040%), and Aleut (63.4%, a difference of 0.040%).
| Demographics | Rating | Rank | Family Households |
| Bulgarians | 3.4 /100 | #229 | Tragic 63.6% |
| Immigrants | Brazil | 3.0 /100 | #230 | Tragic 63.6% |
| Immigrants | Greece | 2.9 /100 | #231 | Tragic 63.5% |
| Immigrants | Northern Africa | 2.6 /100 | #232 | Tragic 63.5% |
| Immigrants | Armenia | 2.6 /100 | #233 | Tragic 63.5% |
| Finns | 2.3 /100 | #234 | Tragic 63.5% |
| Albanians | 2.2 /100 | #235 | Tragic 63.5% |
| Ghanaians | 2.1 /100 | #236 | Tragic 63.5% |
| Comanche | 2.1 /100 | #237 | Tragic 63.5% |
| Immigrants | Zimbabwe | 2.0 /100 | #238 | Tragic 63.5% |
| Aleuts | 1.9 /100 | #239 | Tragic 63.4% |
| South Africans | 1.9 /100 | #240 | Tragic 63.4% |
| Immigrants | St. Vincent and the Grenadines | 1.9 /100 | #241 | Tragic 63.4% |
| Immigrants | Israel | 1.8 /100 | #242 | Tragic 63.4% |
| Immigrants | Czechoslovakia | 1.8 /100 | #243 | Tragic 63.4% |
Demographics Similar to Immigrants from Sudan by Family Households
In terms of family households, the demographic groups most similar to Immigrants from Sudan are Immigrants from Senegal (60.1%, a difference of 0.080%), Sudanese (60.0%, a difference of 0.27%), Senegalese (59.8%, a difference of 0.57%), Immigrants from Saudi Arabia (60.7%, a difference of 0.89%), and Immigrants from Eritrea (60.8%, a difference of 1.1%).
| Demographics | Rating | Rank | Family Households |
| Immigrants | Ethiopia | 0.0 /100 | #333 | Tragic 61.2% |
| Immigrants | Eastern Africa | 0.0 /100 | #334 | Tragic 61.1% |
| Carpatho Rusyns | 0.0 /100 | #335 | Tragic 61.1% |
| German Russians | 0.0 /100 | #336 | Tragic 60.9% |
| Soviet Union | 0.0 /100 | #337 | Tragic 60.9% |
| Immigrants | Eritrea | 0.0 /100 | #338 | Tragic 60.8% |
| Immigrants | Saudi Arabia | 0.0 /100 | #339 | Tragic 60.7% |
| Immigrants | Sudan | 0.0 /100 | #340 | Tragic 60.2% |
| Immigrants | Senegal | 0.0 /100 | #341 | Tragic 60.1% |
| Sudanese | 0.0 /100 | #342 | Tragic 60.0% |
| Senegalese | 0.0 /100 | #343 | Tragic 59.8% |
| Immigrants | Congo | 0.0 /100 | #344 | Tragic 59.2% |
| Immigrants | Zaire | 0.0 /100 | #345 | Tragic 59.2% |
| Somalis | 0.0 /100 | #346 | Tragic 57.6% |
| Immigrants | Somalia | 0.0 /100 | #347 | Tragic 56.7% |