Yaqui vs Apache Family Households
COMPARE
Yaqui
Apache
Family Households
Family Households Comparison
Yaqui
Apache
65.6%
FAMILY HOUSEHOLDS
99.8/ 100
METRIC RATING
78th/ 347
METRIC RANK
66.5%
FAMILY HOUSEHOLDS
100.0/ 100
METRIC RATING
43rd/ 347
METRIC RANK
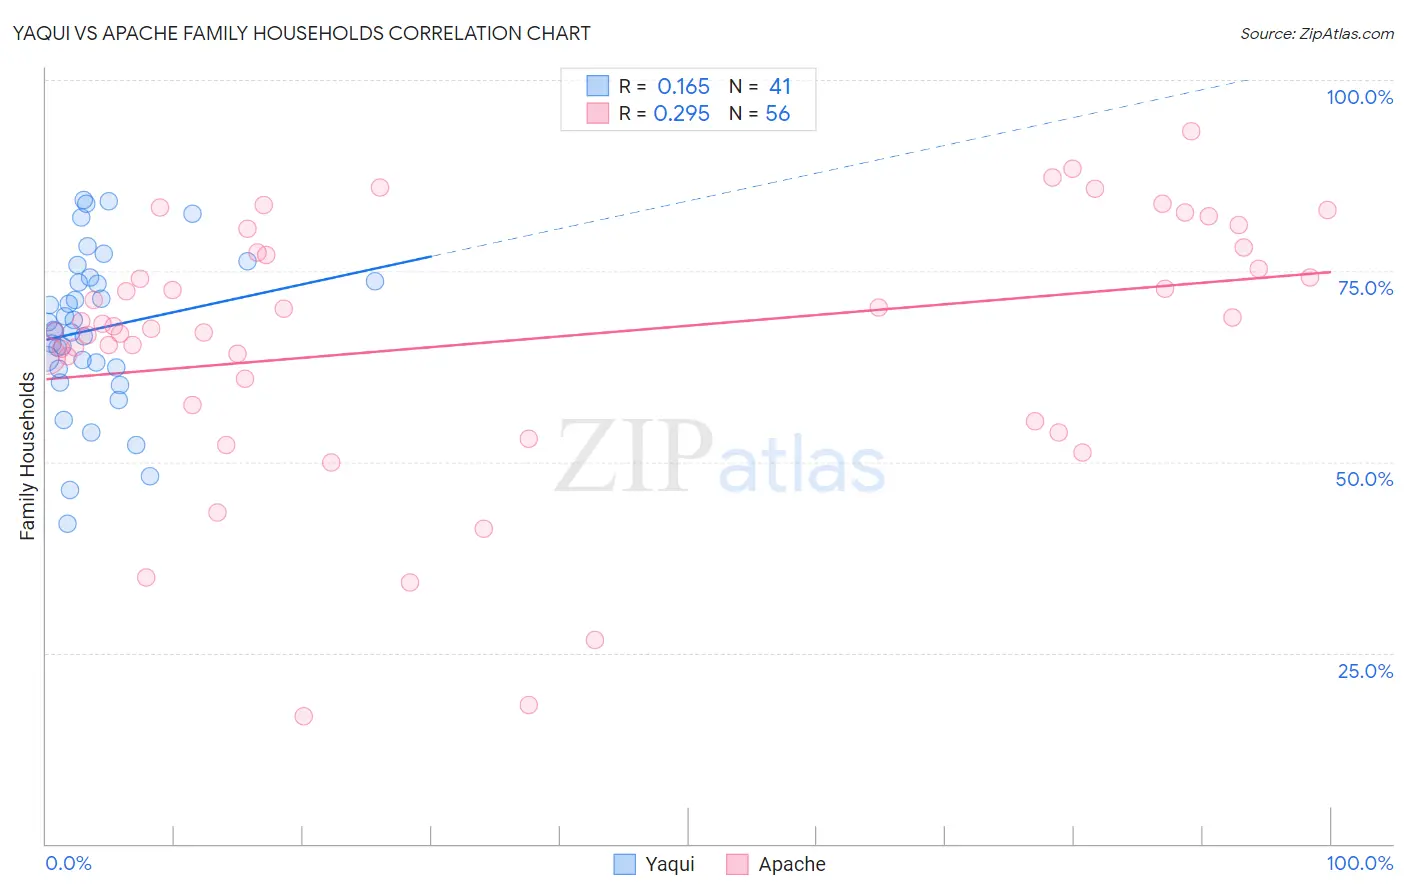
Yaqui vs Apache Family Households Correlation Chart
The statistical analysis conducted on geographies consisting of 107,720,236 people shows a poor positive correlation between the proportion of Yaqui and percentage of family households in the United States with a correlation coefficient (R) of 0.165 and weighted average of 65.6%. Similarly, the statistical analysis conducted on geographies consisting of 231,040,944 people shows a weak positive correlation between the proportion of Apache and percentage of family households in the United States with a correlation coefficient (R) of 0.295 and weighted average of 66.5%, a difference of 1.4%.
Family Households Correlation Summary
| Measurement | Yaqui | Apache |
| Minimum | 41.9% | 16.7% |
| Maximum | 84.2% | 93.2% |
| Range | 42.3% | 76.6% |
| Mean | 67.4% | 66.0% |
| Median | 67.2% | 67.9% |
| Interquartile 25% (IQ1) | 62.3% | 59.1% |
| Interquartile 75% (IQ3) | 73.9% | 77.7% |
| Interquartile Range (IQR) | 11.6% | 18.6% |
| Standard Deviation (Sample) | 10.2% | 17.1% |
| Standard Deviation (Population) | 10.1% | 16.9% |
Similar Demographics by Family Households
Demographics Similar to Yaqui by Family Households
In terms of family households, the demographic groups most similar to Yaqui are Immigrants from South America (65.6%, a difference of 0.0%), Immigrants from the Azores (65.6%, a difference of 0.010%), Immigrants from Costa Rica (65.6%, a difference of 0.030%), Puget Sound Salish (65.6%, a difference of 0.050%), and Houma (65.7%, a difference of 0.12%).
| Demographics | Rating | Rank | Family Households |
| Bhutanese | 99.9 /100 | #71 | Exceptional 65.9% |
| Portuguese | 99.9 /100 | #72 | Exceptional 65.8% |
| Laotians | 99.9 /100 | #73 | Exceptional 65.8% |
| Burmese | 99.9 /100 | #74 | Exceptional 65.7% |
| Houma | 99.9 /100 | #75 | Exceptional 65.7% |
| Immigrants | Azores | 99.8 /100 | #76 | Exceptional 65.6% |
| Immigrants | South America | 99.8 /100 | #77 | Exceptional 65.6% |
| Yaqui | 99.8 /100 | #78 | Exceptional 65.6% |
| Immigrants | Costa Rica | 99.8 /100 | #79 | Exceptional 65.6% |
| Puget Sound Salish | 99.8 /100 | #80 | Exceptional 65.6% |
| Jordanians | 99.7 /100 | #81 | Exceptional 65.5% |
| Immigrants | Lebanon | 99.7 /100 | #82 | Exceptional 65.5% |
| Immigrants | Guyana | 99.6 /100 | #83 | Exceptional 65.5% |
| Americans | 99.6 /100 | #84 | Exceptional 65.5% |
| Immigrants | Cambodia | 99.5 /100 | #85 | Exceptional 65.4% |
Demographics Similar to Apache by Family Households
In terms of family households, the demographic groups most similar to Apache are Menominee (66.5%, a difference of 0.010%), Asian (66.5%, a difference of 0.050%), Immigrants from Bolivia (66.6%, a difference of 0.070%), Venezuelan (66.5%, a difference of 0.070%), and Arapaho (66.5%, a difference of 0.090%).
| Demographics | Rating | Rank | Family Households |
| Peruvians | 100.0 /100 | #36 | Exceptional 67.1% |
| Tsimshian | 100.0 /100 | #37 | Exceptional 67.1% |
| Mexican American Indians | 100.0 /100 | #38 | Exceptional 67.0% |
| Immigrants | El Salvador | 100.0 /100 | #39 | Exceptional 67.0% |
| Guamanians/Chamorros | 100.0 /100 | #40 | Exceptional 66.6% |
| Immigrants | Bolivia | 100.0 /100 | #41 | Exceptional 66.6% |
| Menominee | 100.0 /100 | #42 | Exceptional 66.5% |
| Apache | 100.0 /100 | #43 | Exceptional 66.5% |
| Asians | 100.0 /100 | #44 | Exceptional 66.5% |
| Venezuelans | 100.0 /100 | #45 | Exceptional 66.5% |
| Arapaho | 100.0 /100 | #46 | Exceptional 66.5% |
| Bolivians | 100.0 /100 | #47 | Exceptional 66.5% |
| Immigrants | Venezuela | 100.0 /100 | #48 | Exceptional 66.4% |
| Immigrants | South Central Asia | 100.0 /100 | #49 | Exceptional 66.4% |
| Navajo | 100.0 /100 | #50 | Exceptional 66.4% |