Argentinean vs Guatemalan Average Family Size
COMPARE
Argentinean
Guatemalan
Average Family Size
Average Family Size Comparison
Argentineans
Guatemalans
3.23
AVERAGE FAMILY SIZE
47.4/ 100
METRIC RATING
177th/ 347
METRIC RANK
3.40
AVERAGE FAMILY SIZE
100.0/ 100
METRIC RATING
35th/ 347
METRIC RANK
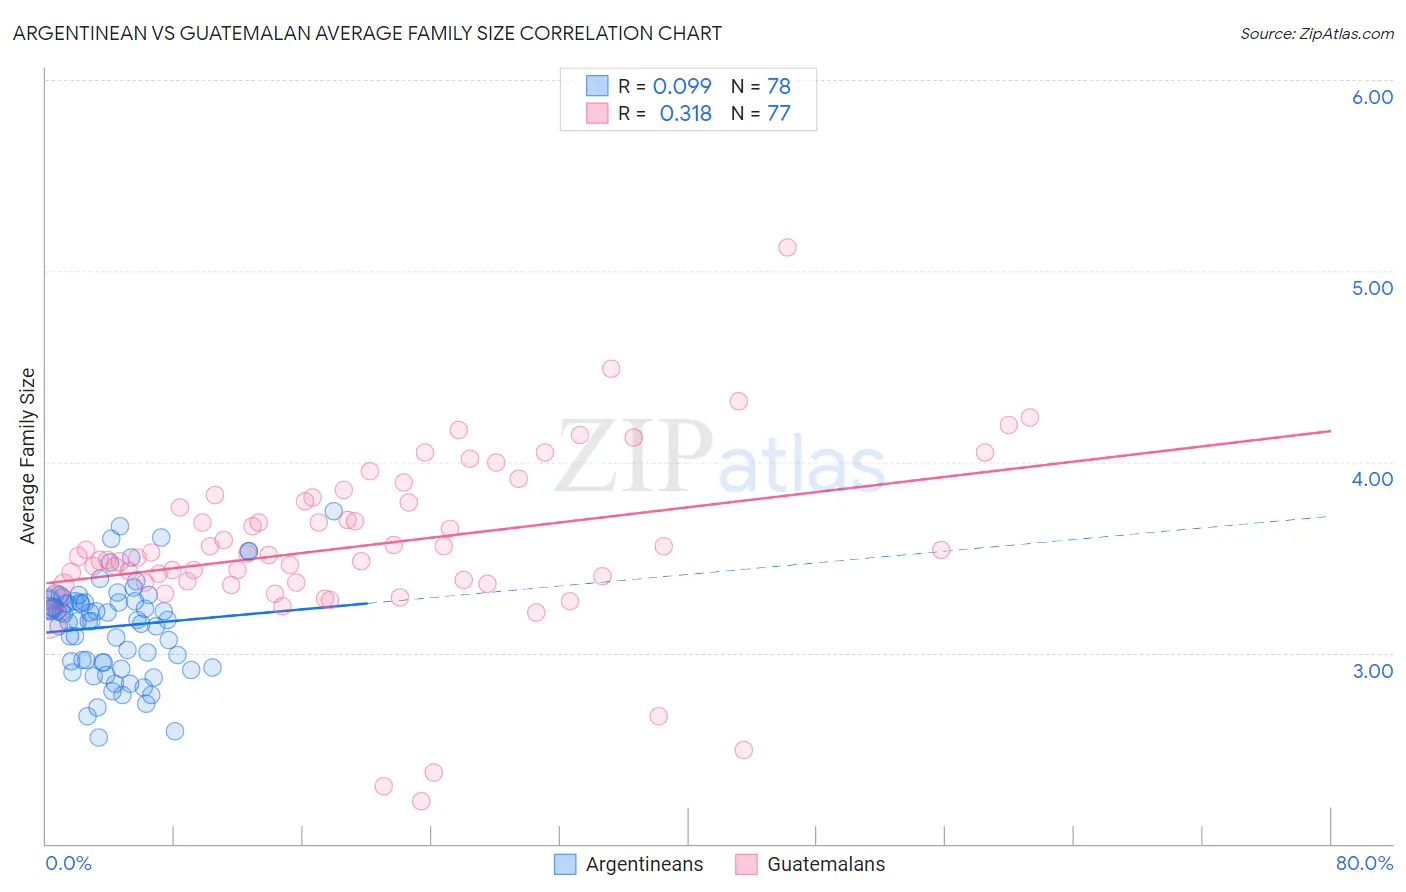
Argentinean vs Guatemalan Average Family Size Correlation Chart
The statistical analysis conducted on geographies consisting of 296,996,433 people shows a slight positive correlation between the proportion of Argentineans and average family size in the United States with a correlation coefficient (R) of 0.099 and weighted average of 3.23. Similarly, the statistical analysis conducted on geographies consisting of 409,298,058 people shows a mild positive correlation between the proportion of Guatemalans and average family size in the United States with a correlation coefficient (R) of 0.318 and weighted average of 3.40, a difference of 5.5%.
Average Family Size Correlation Summary
| Measurement | Argentinean | Guatemalan |
| Minimum | 2.56 | 2.22 |
| Maximum | 3.74 | 5.12 |
| Range | 1.18 | 2.90 |
| Mean | 3.14 | 3.56 |
| Median | 3.19 | 3.51 |
| Interquartile 25% (IQ1) | 2.95 | 3.37 |
| Interquartile 75% (IQ3) | 3.27 | 3.80 |
| Interquartile Range (IQR) | 0.32 | 0.44 |
| Standard Deviation (Sample) | 0.25 | 0.46 |
| Standard Deviation (Population) | 0.25 | 0.45 |
Similar Demographics by Average Family Size
Demographics Similar to Argentineans by Average Family Size
In terms of average family size, the demographic groups most similar to Argentineans are Spaniard (3.23, a difference of 0.0%), Immigrants from Korea (3.23, a difference of 0.010%), Palestinian (3.23, a difference of 0.010%), Israeli (3.23, a difference of 0.020%), and Immigrants from South Central Asia (3.23, a difference of 0.050%).
| Demographics | Rating | Rank | Average Family Size |
| Arabs | 53.8 /100 | #170 | Average 3.23 |
| Chileans | 53.2 /100 | #171 | Average 3.23 |
| Immigrants | Congo | 52.7 /100 | #172 | Average 3.23 |
| Immigrants | Uruguay | 52.0 /100 | #173 | Average 3.23 |
| Immigrants | South Central Asia | 50.0 /100 | #174 | Average 3.23 |
| Immigrants | China | 49.9 /100 | #175 | Average 3.23 |
| Israelis | 48.7 /100 | #176 | Average 3.23 |
| Argentineans | 47.4 /100 | #177 | Average 3.23 |
| Spaniards | 47.2 /100 | #178 | Average 3.23 |
| Immigrants | Korea | 46.9 /100 | #179 | Average 3.23 |
| Palestinians | 46.6 /100 | #180 | Average 3.23 |
| Spanish | 44.8 /100 | #181 | Average 3.23 |
| Moroccans | 44.2 /100 | #182 | Average 3.22 |
| Immigrants | Northern Africa | 41.7 /100 | #183 | Average 3.22 |
| Immigrants | Eastern Asia | 40.8 /100 | #184 | Average 3.22 |
Demographics Similar to Guatemalans by Average Family Size
In terms of average family size, the demographic groups most similar to Guatemalans are Immigrants from Guyana (3.40, a difference of 0.050%), Hispanic or Latino (3.41, a difference of 0.060%), Hawaiian (3.41, a difference of 0.12%), Immigrants from Guatemala (3.41, a difference of 0.14%), and Guyanese (3.40, a difference of 0.19%).
| Demographics | Rating | Rank | Average Family Size |
| Immigrants | Latin America | 100.0 /100 | #28 | Exceptional 3.42 |
| Nepalese | 100.0 /100 | #29 | Exceptional 3.42 |
| Samoans | 100.0 /100 | #30 | Exceptional 3.42 |
| Central Americans | 100.0 /100 | #31 | Exceptional 3.41 |
| Immigrants | Guatemala | 100.0 /100 | #32 | Exceptional 3.41 |
| Hawaiians | 100.0 /100 | #33 | Exceptional 3.41 |
| Hispanics or Latinos | 100.0 /100 | #34 | Exceptional 3.41 |
| Guatemalans | 100.0 /100 | #35 | Exceptional 3.40 |
| Immigrants | Guyana | 100.0 /100 | #36 | Exceptional 3.40 |
| Guyanese | 100.0 /100 | #37 | Exceptional 3.40 |
| Immigrants | Belize | 100.0 /100 | #38 | Exceptional 3.39 |
| Immigrants | Haiti | 100.0 /100 | #39 | Exceptional 3.39 |
| Belizeans | 100.0 /100 | #40 | Exceptional 3.39 |
| Marshallese | 100.0 /100 | #41 | Exceptional 3.38 |
| Immigrants | Vietnam | 100.0 /100 | #42 | Exceptional 3.38 |