Fijian vs Guatemalan Female Disability
COMPARE
Fijian
Guatemalan
Female Disability
Female Disability Comparison
Fijians
Guatemalans
13.1%
FEMALE DISABILITY
0.0/ 100
METRIC RATING
286th/ 347
METRIC RANK
12.1%
FEMALE DISABILITY
63.8/ 100
METRIC RATING
163rd/ 347
METRIC RANK
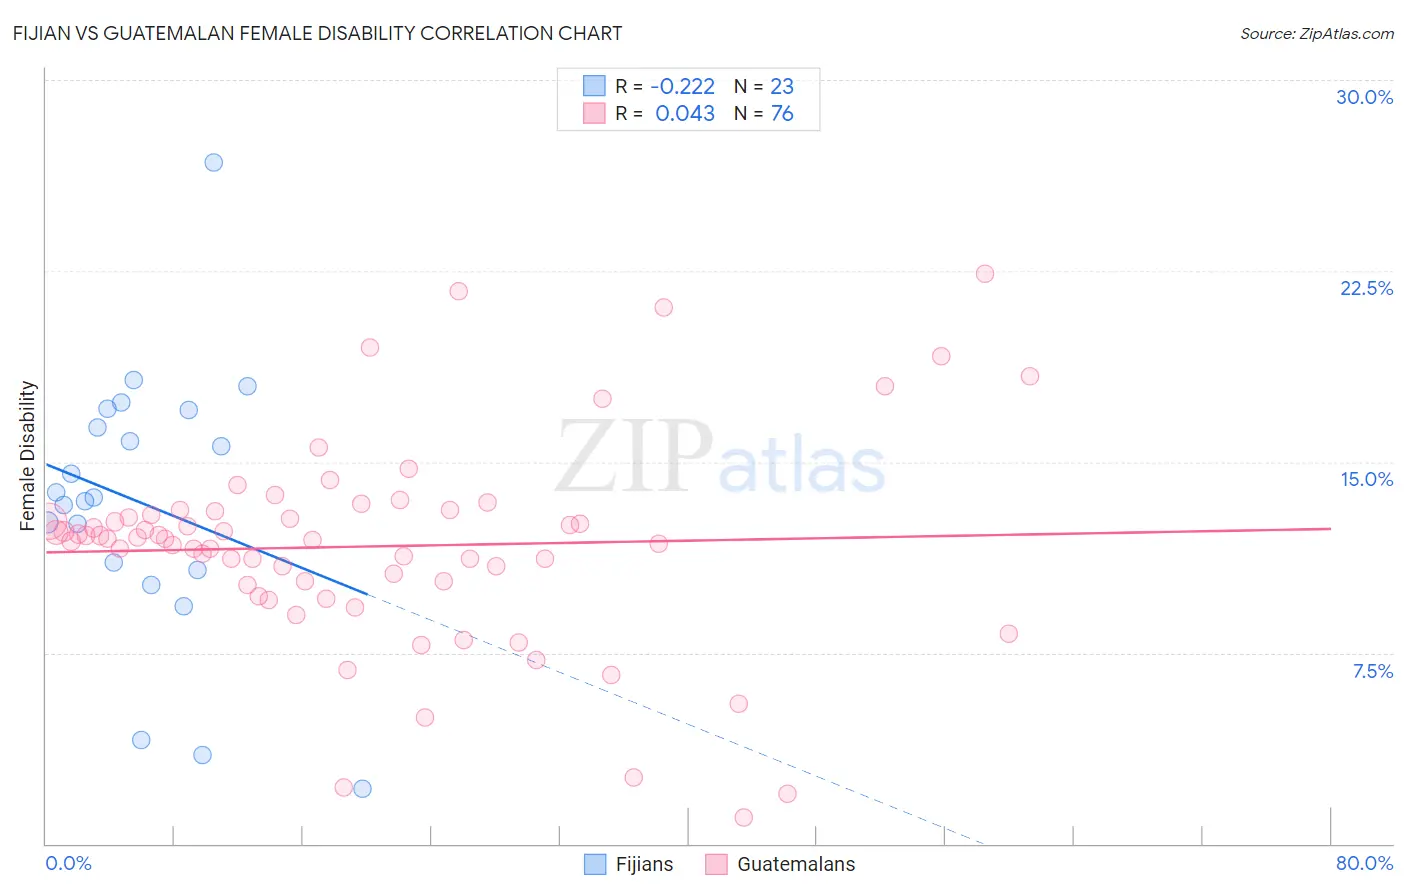
Fijian vs Guatemalan Female Disability Correlation Chart
The statistical analysis conducted on geographies consisting of 55,947,462 people shows a weak negative correlation between the proportion of Fijians and percentage of females with a disability in the United States with a correlation coefficient (R) of -0.222 and weighted average of 13.1%. Similarly, the statistical analysis conducted on geographies consisting of 409,476,424 people shows no correlation between the proportion of Guatemalans and percentage of females with a disability in the United States with a correlation coefficient (R) of 0.043 and weighted average of 12.1%, a difference of 8.0%.
Female Disability Correlation Summary
| Measurement | Fijian | Guatemalan |
| Minimum | 2.2% | 1.0% |
| Maximum | 26.8% | 22.4% |
| Range | 24.6% | 21.4% |
| Mean | 13.4% | 11.7% |
| Median | 13.6% | 12.0% |
| Interquartile 25% (IQ1) | 10.8% | 10.2% |
| Interquartile 75% (IQ3) | 17.0% | 13.0% |
| Interquartile Range (IQR) | 6.3% | 2.7% |
| Standard Deviation (Sample) | 5.4% | 4.0% |
| Standard Deviation (Population) | 5.3% | 4.0% |
Similar Demographics by Female Disability
Demographics Similar to Fijians by Female Disability
In terms of female disability, the demographic groups most similar to Fijians are Bangladeshi (13.1%, a difference of 0.050%), Hmong (13.1%, a difference of 0.10%), English (13.1%, a difference of 0.23%), Welsh (13.1%, a difference of 0.24%), and U.S. Virgin Islander (13.1%, a difference of 0.32%).
| Demographics | Rating | Rank | Female Disability |
| Arapaho | 0.1 /100 | #279 | Tragic 13.0% |
| Irish | 0.1 /100 | #280 | Tragic 13.1% |
| U.S. Virgin Islanders | 0.1 /100 | #281 | Tragic 13.1% |
| Welsh | 0.0 /100 | #282 | Tragic 13.1% |
| English | 0.0 /100 | #283 | Tragic 13.1% |
| Hmong | 0.0 /100 | #284 | Tragic 13.1% |
| Bangladeshis | 0.0 /100 | #285 | Tragic 13.1% |
| Fijians | 0.0 /100 | #286 | Tragic 13.1% |
| Yaqui | 0.0 /100 | #287 | Tragic 13.2% |
| Whites/Caucasians | 0.0 /100 | #288 | Tragic 13.2% |
| Tlingit-Haida | 0.0 /100 | #289 | Tragic 13.2% |
| Immigrants | Yemen | 0.0 /100 | #290 | Tragic 13.2% |
| Shoshone | 0.0 /100 | #291 | Tragic 13.2% |
| Yakama | 0.0 /100 | #292 | Tragic 13.2% |
| Marshallese | 0.0 /100 | #293 | Tragic 13.3% |
Demographics Similar to Guatemalans by Female Disability
In terms of female disability, the demographic groups most similar to Guatemalans are Czech (12.1%, a difference of 0.010%), Immigrants from Ukraine (12.1%, a difference of 0.020%), Guyanese (12.1%, a difference of 0.030%), Immigrants from Oceania (12.1%, a difference of 0.080%), and Immigrants from Guatemala (12.1%, a difference of 0.090%).
| Demographics | Rating | Rank | Female Disability |
| Moroccans | 72.9 /100 | #156 | Good 12.1% |
| Danes | 72.5 /100 | #157 | Good 12.1% |
| Immigrants | Middle Africa | 72.4 /100 | #158 | Good 12.1% |
| Immigrants | Central America | 67.7 /100 | #159 | Good 12.1% |
| Immigrants | Guatemala | 66.0 /100 | #160 | Good 12.1% |
| Guyanese | 64.7 /100 | #161 | Good 12.1% |
| Immigrants | Ukraine | 64.3 /100 | #162 | Good 12.1% |
| Guatemalans | 63.8 /100 | #163 | Good 12.1% |
| Czechs | 63.6 /100 | #164 | Good 12.1% |
| Immigrants | Oceania | 61.8 /100 | #165 | Good 12.1% |
| Lithuanians | 59.5 /100 | #166 | Average 12.2% |
| Immigrants | Latin America | 59.0 /100 | #167 | Average 12.2% |
| Immigrants | Haiti | 58.8 /100 | #168 | Average 12.2% |
| Lebanese | 58.1 /100 | #169 | Average 12.2% |
| Maltese | 57.0 /100 | #170 | Average 12.2% |