Osage vs Guatemalan Average Family Size
COMPARE
Osage
Guatemalan
Average Family Size
Average Family Size Comparison
Osage
Guatemalans
3.18
AVERAGE FAMILY SIZE
3.2/ 100
METRIC RATING
240th/ 347
METRIC RANK
3.40
AVERAGE FAMILY SIZE
100.0/ 100
METRIC RATING
35th/ 347
METRIC RANK
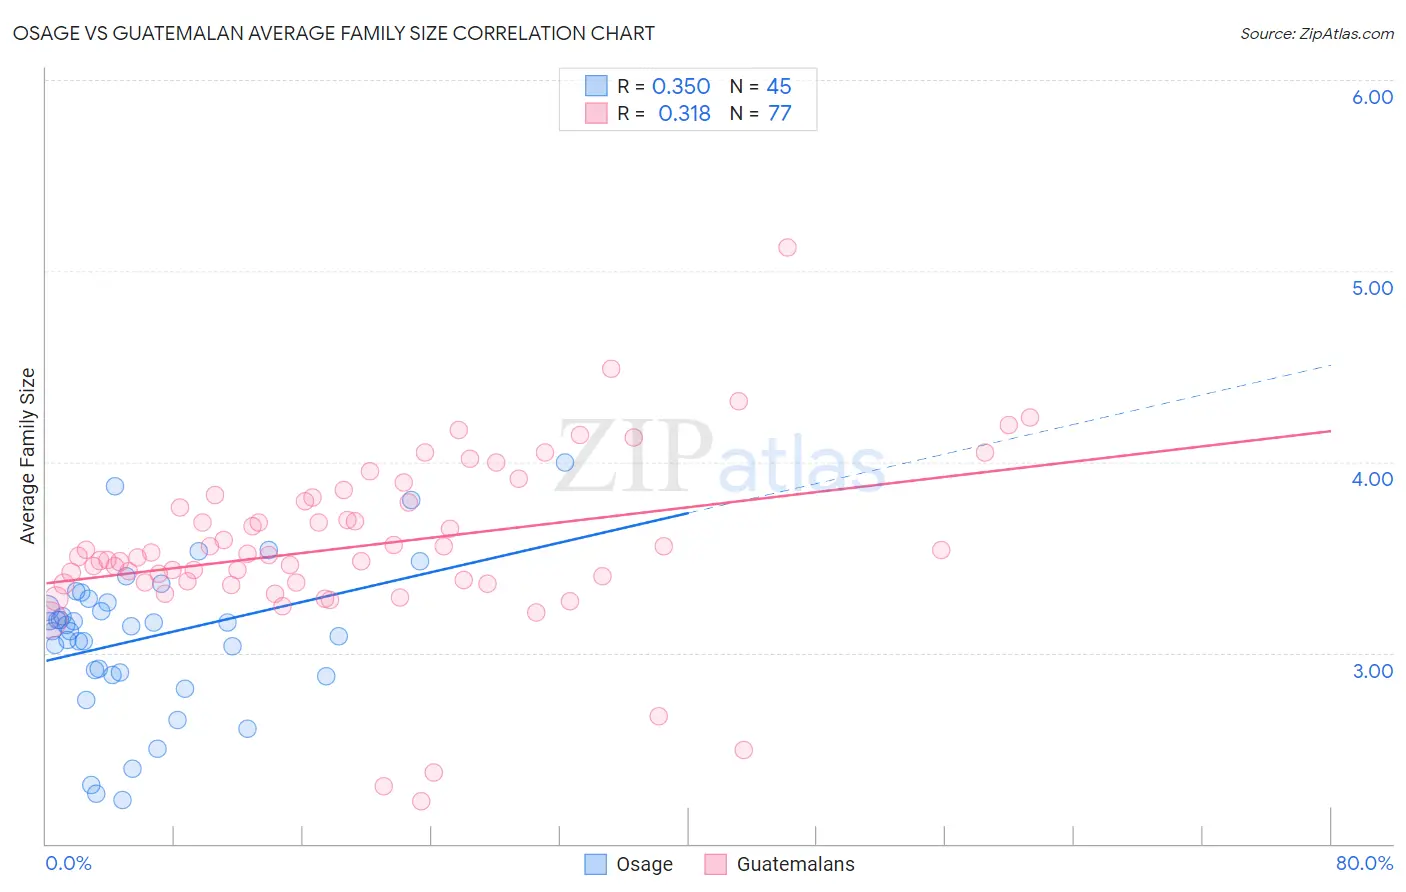
Osage vs Guatemalan Average Family Size Correlation Chart
The statistical analysis conducted on geographies consisting of 91,797,548 people shows a mild positive correlation between the proportion of Osage and average family size in the United States with a correlation coefficient (R) of 0.350 and weighted average of 3.18. Similarly, the statistical analysis conducted on geographies consisting of 409,298,058 people shows a mild positive correlation between the proportion of Guatemalans and average family size in the United States with a correlation coefficient (R) of 0.318 and weighted average of 3.40, a difference of 7.1%.
Average Family Size Correlation Summary
| Measurement | Osage | Guatemalan |
| Minimum | 2.23 | 2.22 |
| Maximum | 4.00 | 5.12 |
| Range | 1.77 | 2.90 |
| Mean | 3.08 | 3.56 |
| Median | 3.14 | 3.51 |
| Interquartile 25% (IQ1) | 2.89 | 3.37 |
| Interquartile 75% (IQ3) | 3.27 | 3.80 |
| Interquartile Range (IQR) | 0.38 | 0.44 |
| Standard Deviation (Sample) | 0.39 | 0.46 |
| Standard Deviation (Population) | 0.38 | 0.45 |
Similar Demographics by Average Family Size
Demographics Similar to Osage by Average Family Size
In terms of average family size, the demographic groups most similar to Osage are Houma (3.18, a difference of 0.020%), Immigrants from Japan (3.18, a difference of 0.020%), Hungarian (3.18, a difference of 0.040%), Immigrants from Moldova (3.18, a difference of 0.040%), and Immigrants from Southern Europe (3.18, a difference of 0.050%).
| Demographics | Rating | Rank | Average Family Size |
| Brazilians | 4.5 /100 | #233 | Tragic 3.18 |
| Iranians | 4.5 /100 | #234 | Tragic 3.18 |
| Immigrants | Turkey | 4.2 /100 | #235 | Tragic 3.18 |
| Immigrants | Portugal | 4.2 /100 | #236 | Tragic 3.18 |
| Immigrants | Romania | 3.7 /100 | #237 | Tragic 3.18 |
| Romanians | 3.7 /100 | #238 | Tragic 3.18 |
| Houma | 3.4 /100 | #239 | Tragic 3.18 |
| Osage | 3.2 /100 | #240 | Tragic 3.18 |
| Immigrants | Japan | 3.0 /100 | #241 | Tragic 3.18 |
| Hungarians | 3.0 /100 | #242 | Tragic 3.18 |
| Immigrants | Moldova | 2.9 /100 | #243 | Tragic 3.18 |
| Immigrants | Southern Europe | 2.9 /100 | #244 | Tragic 3.18 |
| Immigrants | Brazil | 2.7 /100 | #245 | Tragic 3.18 |
| Danes | 2.5 /100 | #246 | Tragic 3.17 |
| Cajuns | 2.4 /100 | #247 | Tragic 3.17 |
Demographics Similar to Guatemalans by Average Family Size
In terms of average family size, the demographic groups most similar to Guatemalans are Immigrants from Guyana (3.40, a difference of 0.050%), Hispanic or Latino (3.41, a difference of 0.060%), Hawaiian (3.41, a difference of 0.12%), Immigrants from Guatemala (3.41, a difference of 0.14%), and Guyanese (3.40, a difference of 0.19%).
| Demographics | Rating | Rank | Average Family Size |
| Immigrants | Latin America | 100.0 /100 | #28 | Exceptional 3.42 |
| Nepalese | 100.0 /100 | #29 | Exceptional 3.42 |
| Samoans | 100.0 /100 | #30 | Exceptional 3.42 |
| Central Americans | 100.0 /100 | #31 | Exceptional 3.41 |
| Immigrants | Guatemala | 100.0 /100 | #32 | Exceptional 3.41 |
| Hawaiians | 100.0 /100 | #33 | Exceptional 3.41 |
| Hispanics or Latinos | 100.0 /100 | #34 | Exceptional 3.41 |
| Guatemalans | 100.0 /100 | #35 | Exceptional 3.40 |
| Immigrants | Guyana | 100.0 /100 | #36 | Exceptional 3.40 |
| Guyanese | 100.0 /100 | #37 | Exceptional 3.40 |
| Immigrants | Belize | 100.0 /100 | #38 | Exceptional 3.39 |
| Immigrants | Haiti | 100.0 /100 | #39 | Exceptional 3.39 |
| Belizeans | 100.0 /100 | #40 | Exceptional 3.39 |
| Marshallese | 100.0 /100 | #41 | Exceptional 3.38 |
| Immigrants | Vietnam | 100.0 /100 | #42 | Exceptional 3.38 |