Senegalese vs Bhutanese Average Family Size
COMPARE
Senegalese
Bhutanese
Average Family Size
Average Family Size Comparison
Senegalese
Bhutanese
3.21
AVERAGE FAMILY SIZE
28.2/ 100
METRIC RATING
196th/ 347
METRIC RANK
3.25
AVERAGE FAMILY SIZE
81.0/ 100
METRIC RATING
143rd/ 347
METRIC RANK
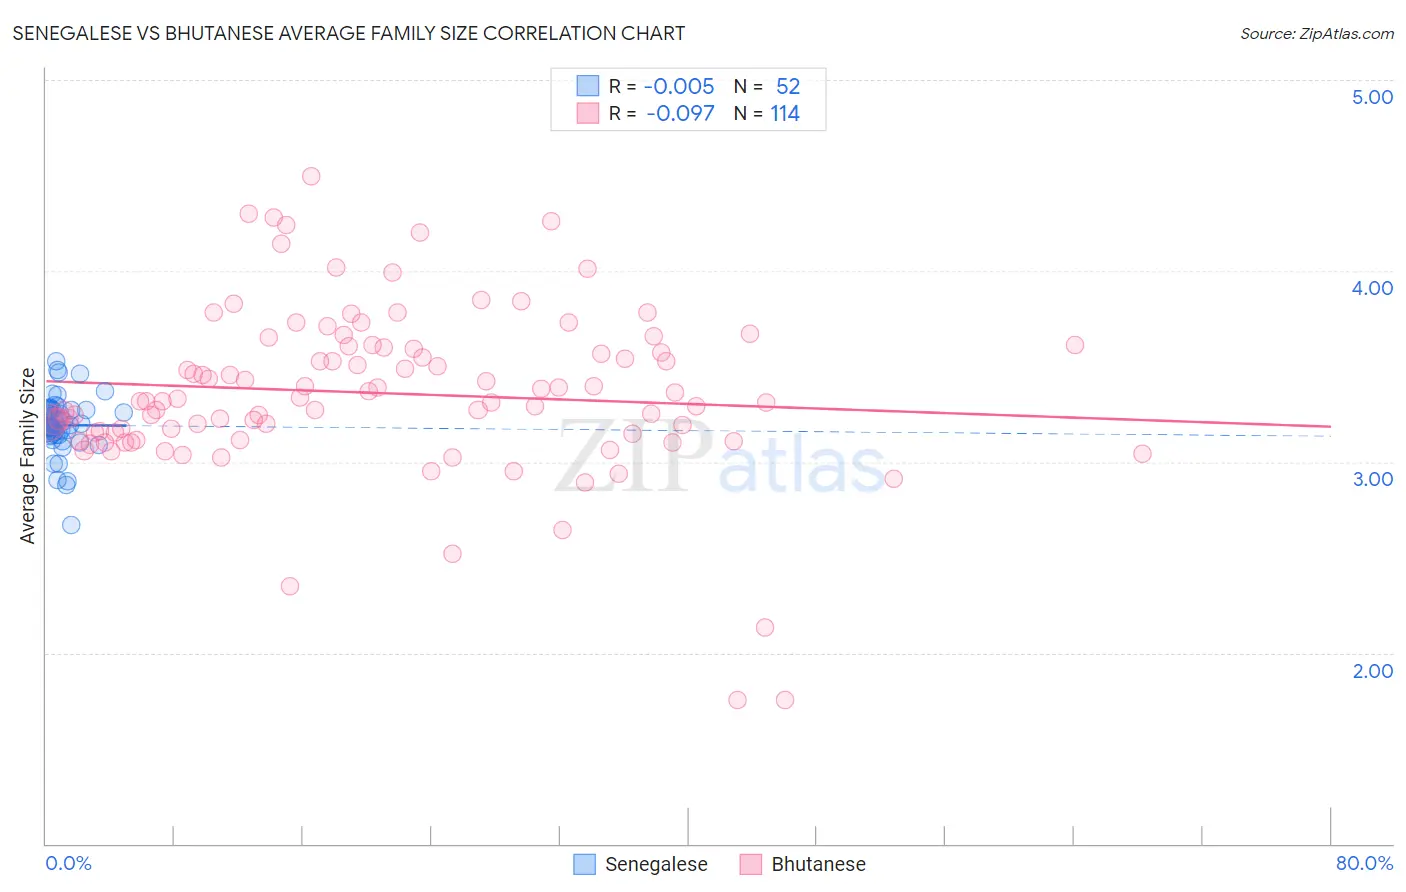
Senegalese vs Bhutanese Average Family Size Correlation Chart
The statistical analysis conducted on geographies consisting of 78,113,781 people shows no correlation between the proportion of Senegalese and average family size in the United States with a correlation coefficient (R) of -0.005 and weighted average of 3.21. Similarly, the statistical analysis conducted on geographies consisting of 455,147,723 people shows a slight negative correlation between the proportion of Bhutanese and average family size in the United States with a correlation coefficient (R) of -0.097 and weighted average of 3.25, a difference of 1.1%.
Average Family Size Correlation Summary
| Measurement | Senegalese | Bhutanese |
| Minimum | 2.67 | 1.75 |
| Maximum | 3.53 | 4.49 |
| Range | 0.86 | 2.74 |
| Mean | 3.19 | 3.36 |
| Median | 3.19 | 3.32 |
| Interquartile 25% (IQ1) | 3.14 | 3.15 |
| Interquartile 75% (IQ3) | 3.27 | 3.60 |
| Interquartile Range (IQR) | 0.13 | 0.45 |
| Standard Deviation (Sample) | 0.15 | 0.44 |
| Standard Deviation (Population) | 0.15 | 0.44 |
Similar Demographics by Average Family Size
Demographics Similar to Senegalese by Average Family Size
In terms of average family size, the demographic groups most similar to Senegalese are Choctaw (3.21, a difference of 0.0%), Kenyan (3.21, a difference of 0.0%), Immigrants from Israel (3.22, a difference of 0.020%), Immigrants from Sudan (3.22, a difference of 0.020%), and Immigrants from Eastern Africa (3.22, a difference of 0.040%).
| Demographics | Rating | Rank | Average Family Size |
| Pakistanis | 33.7 /100 | #189 | Fair 3.22 |
| Burmese | 31.0 /100 | #190 | Fair 3.22 |
| Immigrants | Zaire | 30.5 /100 | #191 | Fair 3.22 |
| Immigrants | Eastern Africa | 30.1 /100 | #192 | Fair 3.22 |
| Immigrants | Israel | 29.3 /100 | #193 | Fair 3.22 |
| Immigrants | Sudan | 29.1 /100 | #194 | Fair 3.22 |
| Choctaw | 28.3 /100 | #195 | Fair 3.21 |
| Senegalese | 28.2 /100 | #196 | Fair 3.21 |
| Kenyans | 28.0 /100 | #197 | Fair 3.21 |
| Immigrants | Azores | 21.7 /100 | #198 | Fair 3.21 |
| Hmong | 20.7 /100 | #199 | Fair 3.21 |
| Immigrants | Kenya | 19.2 /100 | #200 | Poor 3.21 |
| Immigrants | Morocco | 18.5 /100 | #201 | Poor 3.21 |
| Immigrants | India | 18.5 /100 | #202 | Poor 3.21 |
| Immigrants | Nepal | 18.1 /100 | #203 | Poor 3.21 |
Demographics Similar to Bhutanese by Average Family Size
In terms of average family size, the demographic groups most similar to Bhutanese are Venezuelan (3.25, a difference of 0.010%), Liberian (3.25, a difference of 0.010%), Immigrants from Ethiopia (3.25, a difference of 0.020%), Subsaharan African (3.25, a difference of 0.020%), and Tsimshian (3.25, a difference of 0.020%).
| Demographics | Rating | Rank | Average Family Size |
| Comanche | 82.8 /100 | #136 | Excellent 3.25 |
| Immigrants | Middle Africa | 82.4 /100 | #137 | Excellent 3.25 |
| Cubans | 81.8 /100 | #138 | Excellent 3.25 |
| Immigrants | Ethiopia | 81.6 /100 | #139 | Excellent 3.25 |
| Sub-Saharan Africans | 81.6 /100 | #140 | Excellent 3.25 |
| Venezuelans | 81.4 /100 | #141 | Excellent 3.25 |
| Liberians | 81.2 /100 | #142 | Excellent 3.25 |
| Bhutanese | 81.0 /100 | #143 | Excellent 3.25 |
| Tsimshian | 80.2 /100 | #144 | Excellent 3.25 |
| Armenians | 78.2 /100 | #145 | Good 3.25 |
| Immigrants | Africa | 77.9 /100 | #146 | Good 3.25 |
| Immigrants | Jordan | 75.7 /100 | #147 | Good 3.24 |
| Blackfeet | 75.0 /100 | #148 | Good 3.24 |
| Assyrians/Chaldeans/Syriacs | 73.8 /100 | #149 | Good 3.24 |
| Indians (Asian) | 73.6 /100 | #150 | Good 3.24 |