Immigrants from the Azores vs Bhutanese Average Family Size
COMPARE
Immigrants from the Azores
Bhutanese
Average Family Size
Average Family Size Comparison
Immigrants from the Azores
Bhutanese
3.21
AVERAGE FAMILY SIZE
21.7/ 100
METRIC RATING
198th/ 347
METRIC RANK
3.25
AVERAGE FAMILY SIZE
81.0/ 100
METRIC RATING
143rd/ 347
METRIC RANK
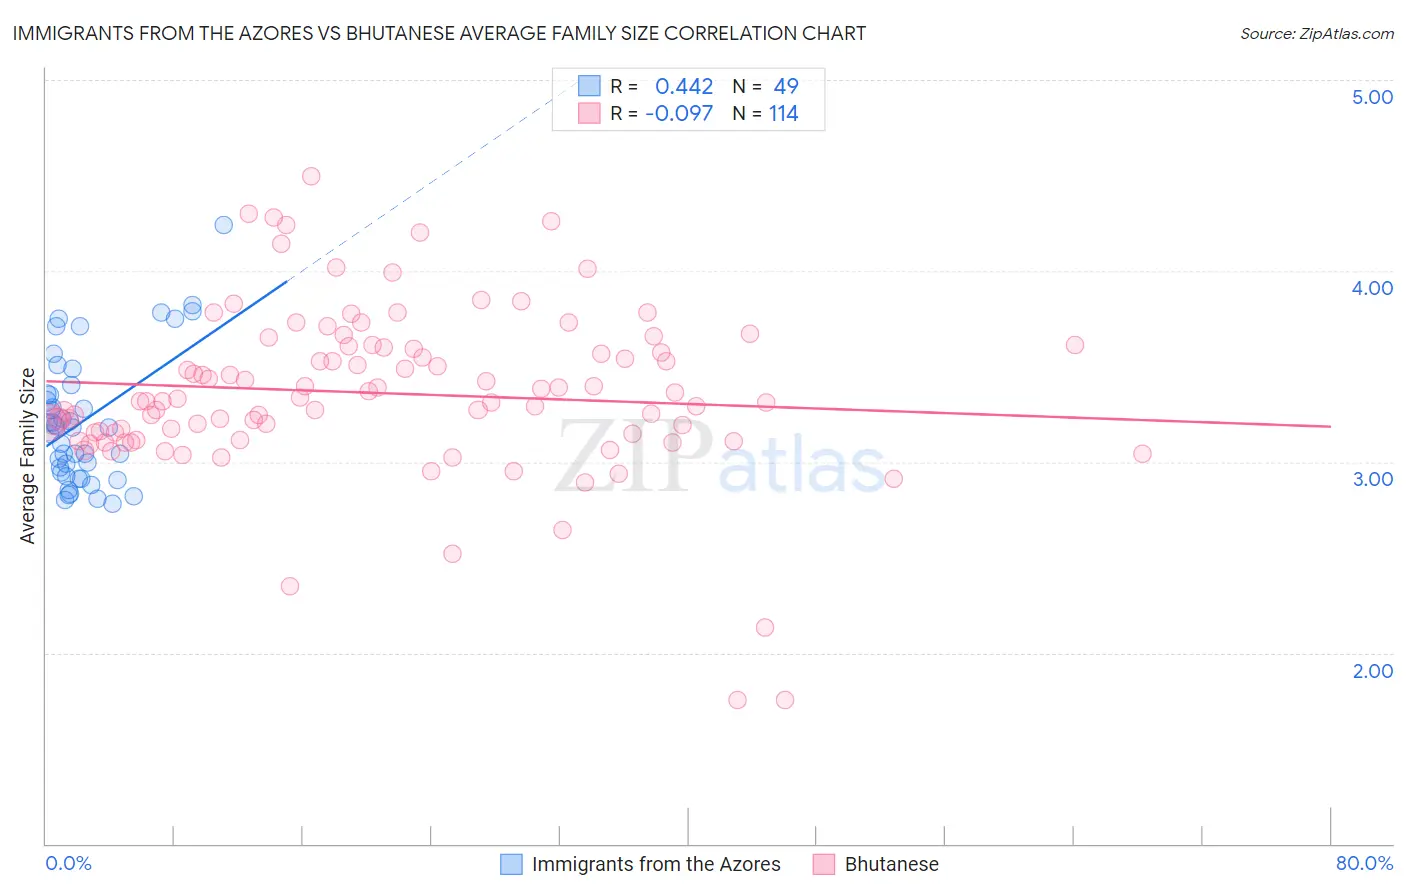
Immigrants from the Azores vs Bhutanese Average Family Size Correlation Chart
The statistical analysis conducted on geographies consisting of 46,257,310 people shows a moderate positive correlation between the proportion of Immigrants from the Azores and average family size in the United States with a correlation coefficient (R) of 0.442 and weighted average of 3.21. Similarly, the statistical analysis conducted on geographies consisting of 455,147,723 people shows a slight negative correlation between the proportion of Bhutanese and average family size in the United States with a correlation coefficient (R) of -0.097 and weighted average of 3.25, a difference of 1.3%.
Average Family Size Correlation Summary
| Measurement | Immigrants from the Azores | Bhutanese |
| Minimum | 2.78 | 1.75 |
| Maximum | 4.24 | 4.49 |
| Range | 1.46 | 2.74 |
| Mean | 3.22 | 3.36 |
| Median | 3.18 | 3.32 |
| Interquartile 25% (IQ1) | 2.93 | 3.15 |
| Interquartile 75% (IQ3) | 3.38 | 3.60 |
| Interquartile Range (IQR) | 0.44 | 0.45 |
| Standard Deviation (Sample) | 0.34 | 0.44 |
| Standard Deviation (Population) | 0.34 | 0.44 |
Similar Demographics by Average Family Size
Demographics Similar to Immigrants from the Azores by Average Family Size
In terms of average family size, the demographic groups most similar to Immigrants from the Azores are Hmong (3.21, a difference of 0.020%), Immigrants from Kenya (3.21, a difference of 0.070%), Immigrants from Morocco (3.21, a difference of 0.090%), Immigrants from India (3.21, a difference of 0.090%), and Immigrants from Nepal (3.21, a difference of 0.10%).
| Demographics | Rating | Rank | Average Family Size |
| Immigrants | Zaire | 30.5 /100 | #191 | Fair 3.22 |
| Immigrants | Eastern Africa | 30.1 /100 | #192 | Fair 3.22 |
| Immigrants | Israel | 29.3 /100 | #193 | Fair 3.22 |
| Immigrants | Sudan | 29.1 /100 | #194 | Fair 3.22 |
| Choctaw | 28.3 /100 | #195 | Fair 3.21 |
| Senegalese | 28.2 /100 | #196 | Fair 3.21 |
| Kenyans | 28.0 /100 | #197 | Fair 3.21 |
| Immigrants | Azores | 21.7 /100 | #198 | Fair 3.21 |
| Hmong | 20.7 /100 | #199 | Fair 3.21 |
| Immigrants | Kenya | 19.2 /100 | #200 | Poor 3.21 |
| Immigrants | Morocco | 18.5 /100 | #201 | Poor 3.21 |
| Immigrants | India | 18.5 /100 | #202 | Poor 3.21 |
| Immigrants | Nepal | 18.1 /100 | #203 | Poor 3.21 |
| Immigrants | Poland | 16.6 /100 | #204 | Poor 3.20 |
| Paraguayans | 16.3 /100 | #205 | Poor 3.20 |
Demographics Similar to Bhutanese by Average Family Size
In terms of average family size, the demographic groups most similar to Bhutanese are Venezuelan (3.25, a difference of 0.010%), Liberian (3.25, a difference of 0.010%), Immigrants from Ethiopia (3.25, a difference of 0.020%), Subsaharan African (3.25, a difference of 0.020%), and Tsimshian (3.25, a difference of 0.020%).
| Demographics | Rating | Rank | Average Family Size |
| Comanche | 82.8 /100 | #136 | Excellent 3.25 |
| Immigrants | Middle Africa | 82.4 /100 | #137 | Excellent 3.25 |
| Cubans | 81.8 /100 | #138 | Excellent 3.25 |
| Immigrants | Ethiopia | 81.6 /100 | #139 | Excellent 3.25 |
| Sub-Saharan Africans | 81.6 /100 | #140 | Excellent 3.25 |
| Venezuelans | 81.4 /100 | #141 | Excellent 3.25 |
| Liberians | 81.2 /100 | #142 | Excellent 3.25 |
| Bhutanese | 81.0 /100 | #143 | Excellent 3.25 |
| Tsimshian | 80.2 /100 | #144 | Excellent 3.25 |
| Armenians | 78.2 /100 | #145 | Good 3.25 |
| Immigrants | Africa | 77.9 /100 | #146 | Good 3.25 |
| Immigrants | Jordan | 75.7 /100 | #147 | Good 3.24 |
| Blackfeet | 75.0 /100 | #148 | Good 3.24 |
| Assyrians/Chaldeans/Syriacs | 73.8 /100 | #149 | Good 3.24 |
| Indians (Asian) | 73.6 /100 | #150 | Good 3.24 |