Indonesian vs Immigrants Married-couple Households
COMPARE
Indonesian
Immigrants
Married-couple Households
Married-couple Households Comparison
Indonesians
Immigrants
42.0%
MARRIED-COUPLE HOUSEHOLDS
0.0/ 100
METRIC RATING
292nd/ 347
METRIC RANK
46.3%
MARRIED-COUPLE HOUSEHOLDS
43.8/ 100
METRIC RATING
177th/ 347
METRIC RANK
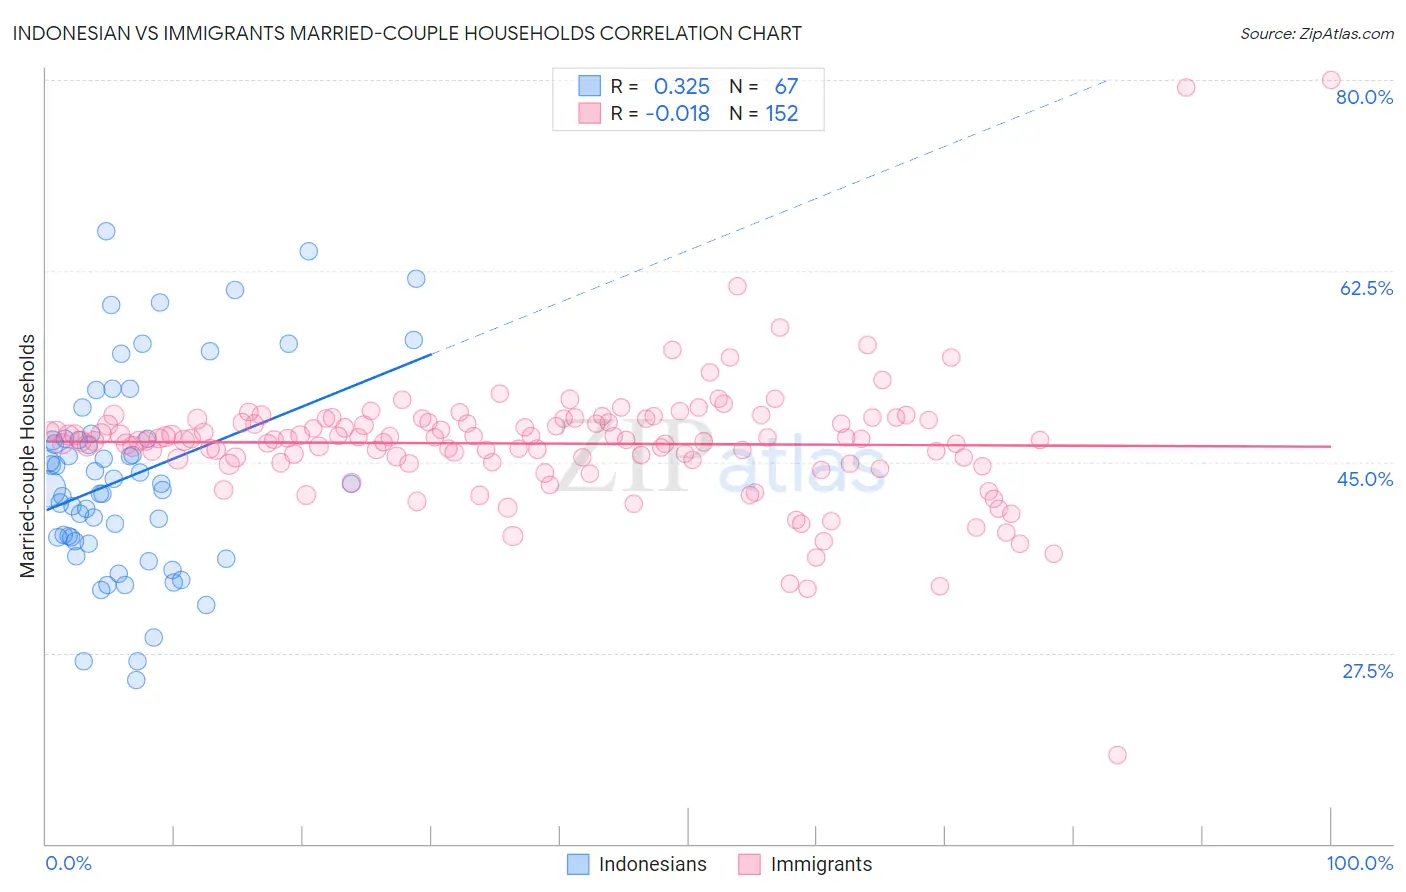
Indonesian vs Immigrants Married-couple Households Correlation Chart
The statistical analysis conducted on geographies consisting of 162,636,634 people shows a mild positive correlation between the proportion of Indonesians and percentage of married-couple family households in the United States with a correlation coefficient (R) of 0.325 and weighted average of 42.0%. Similarly, the statistical analysis conducted on geographies consisting of 577,047,094 people shows no correlation between the proportion of Immigrants and percentage of married-couple family households in the United States with a correlation coefficient (R) of -0.018 and weighted average of 46.3%, a difference of 10.2%.
Married-couple Households Correlation Summary
| Measurement | Indonesian | Immigrants |
| Minimum | 25.1% | 18.2% |
| Maximum | 66.1% | 80.0% |
| Range | 41.1% | 61.8% |
| Mean | 43.7% | 46.7% |
| Median | 43.0% | 47.1% |
| Interquartile 25% (IQ1) | 37.8% | 45.1% |
| Interquartile 75% (IQ3) | 47.2% | 48.7% |
| Interquartile Range (IQR) | 9.4% | 3.7% |
| Standard Deviation (Sample) | 9.1% | 6.1% |
| Standard Deviation (Population) | 9.0% | 6.1% |
Similar Demographics by Married-couple Households
Demographics Similar to Indonesians by Married-couple Households
In terms of married-couple households, the demographic groups most similar to Indonesians are Paiute (42.1%, a difference of 0.050%), Honduran (42.1%, a difference of 0.060%), Sudanese (42.1%, a difference of 0.11%), Menominee (42.0%, a difference of 0.11%), and Immigrants from Yemen (42.0%, a difference of 0.12%).
| Demographics | Rating | Rank | Married-couple Households |
| Ghanaians | 0.0 /100 | #285 | Tragic 42.2% |
| Belizeans | 0.0 /100 | #286 | Tragic 42.2% |
| Chippewa | 0.0 /100 | #287 | Tragic 42.1% |
| Immigrants | Eritrea | 0.0 /100 | #288 | Tragic 42.1% |
| Sudanese | 0.0 /100 | #289 | Tragic 42.1% |
| Hondurans | 0.0 /100 | #290 | Tragic 42.1% |
| Paiute | 0.0 /100 | #291 | Tragic 42.1% |
| Indonesians | 0.0 /100 | #292 | Tragic 42.0% |
| Menominee | 0.0 /100 | #293 | Tragic 42.0% |
| Immigrants | Yemen | 0.0 /100 | #294 | Tragic 42.0% |
| Kiowa | 0.0 /100 | #295 | Tragic 42.0% |
| Immigrants | Sudan | 0.0 /100 | #296 | Tragic 41.9% |
| Arapaho | 0.0 /100 | #297 | Tragic 41.8% |
| Immigrants | Middle Africa | 0.0 /100 | #298 | Tragic 41.8% |
| Immigrants | Ghana | 0.0 /100 | #299 | Tragic 41.8% |
Demographics Similar to Immigrants by Married-couple Households
In terms of married-couple households, the demographic groups most similar to Immigrants are Immigrants from Costa Rica (46.3%, a difference of 0.020%), Immigrants from Zimbabwe (46.3%, a difference of 0.030%), Cajun (46.4%, a difference of 0.060%), Mongolian (46.3%, a difference of 0.070%), and Malaysian (46.3%, a difference of 0.080%).
| Demographics | Rating | Rank | Married-couple Households |
| South Americans | 58.0 /100 | #170 | Average 46.6% |
| Immigrants | Chile | 55.7 /100 | #171 | Average 46.5% |
| Immigrants | Australia | 54.6 /100 | #172 | Average 46.5% |
| Immigrants | Norway | 52.0 /100 | #173 | Average 46.5% |
| Immigrants | Mexico | 50.0 /100 | #174 | Average 46.4% |
| Immigrants | Colombia | 46.1 /100 | #175 | Average 46.4% |
| Cajuns | 45.2 /100 | #176 | Average 46.4% |
| Immigrants | Immigrants | 43.8 /100 | #177 | Average 46.3% |
| Immigrants | Costa Rica | 43.4 /100 | #178 | Average 46.3% |
| Immigrants | Zimbabwe | 43.0 /100 | #179 | Average 46.3% |
| Mongolians | 42.0 /100 | #180 | Average 46.3% |
| Malaysians | 41.8 /100 | #181 | Average 46.3% |
| Yugoslavians | 38.9 /100 | #182 | Fair 46.2% |
| Immigrants | Brazil | 38.3 /100 | #183 | Fair 46.2% |
| Immigrants | Switzerland | 36.9 /100 | #184 | Fair 46.2% |