Ethiopian vs Immigrants Disability Age 35 to 64
COMPARE
Ethiopian
Immigrants
Disability Age 35 to 64
Disability Age 35 to 64 Comparison
Ethiopians
Immigrants
10.5%
DISABILITY AGE 35 TO 64
97.4/ 100
METRIC RATING
108th/ 347
METRIC RANK
10.7%
DISABILITY AGE 35 TO 64
92.5/ 100
METRIC RATING
133rd/ 347
METRIC RANK
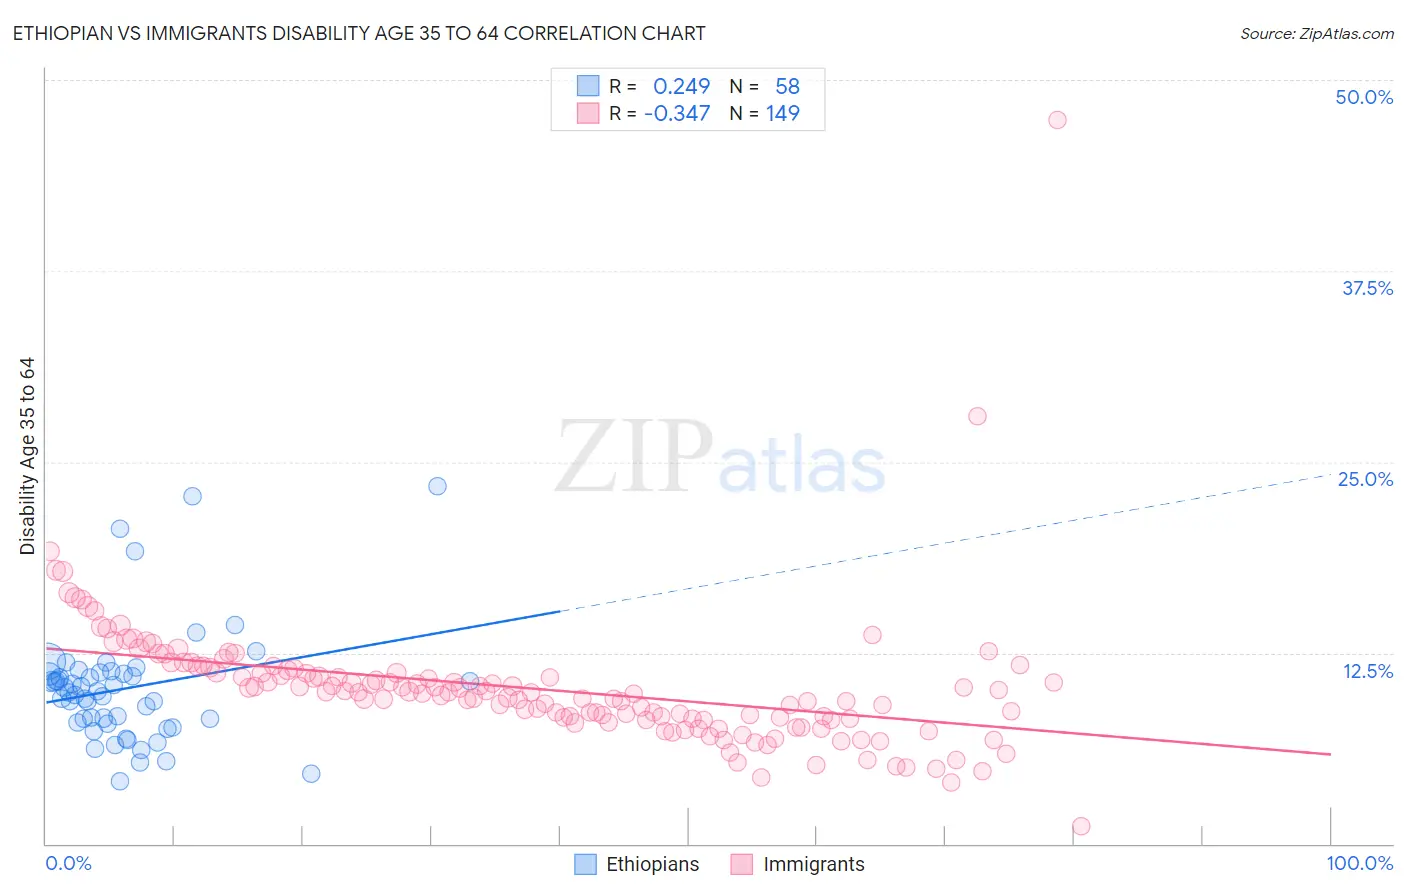
Ethiopian vs Immigrants Disability Age 35 to 64 Correlation Chart
The statistical analysis conducted on geographies consisting of 223,074,665 people shows a weak positive correlation between the proportion of Ethiopians and percentage of population with a disability between the ages 34 and 64 in the United States with a correlation coefficient (R) of 0.249 and weighted average of 10.5%. Similarly, the statistical analysis conducted on geographies consisting of 576,523,974 people shows a mild negative correlation between the proportion of Immigrants and percentage of population with a disability between the ages 34 and 64 in the United States with a correlation coefficient (R) of -0.347 and weighted average of 10.7%, a difference of 2.4%.
Disability Age 35 to 64 Correlation Summary
| Measurement | Ethiopian | Immigrants |
| Minimum | 4.1% | 1.1% |
| Maximum | 23.4% | 47.4% |
| Range | 19.4% | 46.2% |
| Mean | 10.2% | 10.2% |
| Median | 9.9% | 9.9% |
| Interquartile 25% (IQ1) | 8.0% | 8.1% |
| Interquartile 75% (IQ3) | 11.2% | 11.3% |
| Interquartile Range (IQR) | 3.2% | 3.1% |
| Standard Deviation (Sample) | 3.8% | 4.4% |
| Standard Deviation (Population) | 3.8% | 4.4% |
Similar Demographics by Disability Age 35 to 64
Demographics Similar to Ethiopians by Disability Age 35 to 64
In terms of disability age 35 to 64, the demographic groups most similar to Ethiopians are Zimbabwean (10.4%, a difference of 0.020%), Immigrants from Ethiopia (10.5%, a difference of 0.14%), Korean (10.5%, a difference of 0.20%), Immigrants from Hungary (10.4%, a difference of 0.21%), and Macedonian (10.4%, a difference of 0.36%).
| Demographics | Rating | Rank | Disability Age 35 to 64 |
| Immigrants | Philippines | 98.0 /100 | #101 | Exceptional 10.4% |
| Immigrants | Western Asia | 98.0 /100 | #102 | Exceptional 10.4% |
| Immigrants | Ukraine | 97.9 /100 | #103 | Exceptional 10.4% |
| Immigrants | Austria | 97.8 /100 | #104 | Exceptional 10.4% |
| Macedonians | 97.8 /100 | #105 | Exceptional 10.4% |
| Immigrants | Hungary | 97.6 /100 | #106 | Exceptional 10.4% |
| Zimbabweans | 97.4 /100 | #107 | Exceptional 10.4% |
| Ethiopians | 97.4 /100 | #108 | Exceptional 10.5% |
| Immigrants | Ethiopia | 97.2 /100 | #109 | Exceptional 10.5% |
| Koreans | 97.1 /100 | #110 | Exceptional 10.5% |
| Brazilians | 96.9 /100 | #111 | Exceptional 10.5% |
| Assyrians/Chaldeans/Syriacs | 96.8 /100 | #112 | Exceptional 10.5% |
| Tongans | 96.6 /100 | #113 | Exceptional 10.5% |
| Immigrants | Morocco | 96.6 /100 | #114 | Exceptional 10.5% |
| Immigrants | Netherlands | 96.3 /100 | #115 | Exceptional 10.5% |
Demographics Similar to Immigrants by Disability Age 35 to 64
In terms of disability age 35 to 64, the demographic groups most similar to Immigrants are Immigrants from Albania (10.7%, a difference of 0.0%), Immigrants from Ecuador (10.7%, a difference of 0.0%), Greek (10.7%, a difference of 0.050%), Immigrants from El Salvador (10.7%, a difference of 0.11%), and Immigrants from Syria (10.7%, a difference of 0.16%).
| Demographics | Rating | Rank | Disability Age 35 to 64 |
| Immigrants | Afghanistan | 94.1 /100 | #126 | Exceptional 10.6% |
| Immigrants | Zimbabwe | 94.0 /100 | #127 | Exceptional 10.6% |
| South Africans | 93.3 /100 | #128 | Exceptional 10.7% |
| Ecuadorians | 93.1 /100 | #129 | Exceptional 10.7% |
| Immigrants | Syria | 93.0 /100 | #130 | Exceptional 10.7% |
| Immigrants | El Salvador | 92.8 /100 | #131 | Exceptional 10.7% |
| Immigrants | Albania | 92.5 /100 | #132 | Exceptional 10.7% |
| Immigrants | Immigrants | 92.5 /100 | #133 | Exceptional 10.7% |
| Immigrants | Ecuador | 92.5 /100 | #134 | Exceptional 10.7% |
| Greeks | 92.3 /100 | #135 | Exceptional 10.7% |
| Salvadorans | 91.9 /100 | #136 | Exceptional 10.7% |
| Immigrants | Costa Rica | 91.7 /100 | #137 | Exceptional 10.7% |
| Immigrants | Southern Europe | 91.5 /100 | #138 | Exceptional 10.7% |
| Costa Ricans | 91.4 /100 | #139 | Exceptional 10.7% |
| Immigrants | Scotland | 91.3 /100 | #140 | Exceptional 10.7% |