Estonian vs Immigrants from Saudi Arabia Currently Married
COMPARE
Estonian
Immigrants from Saudi Arabia
Currently Married
Currently Married Comparison
Estonians
Immigrants from Saudi Arabia
48.2%
CURRENTLY MARRIED
97.4/ 100
METRIC RATING
74th/ 347
METRIC RANK
44.7%
CURRENTLY MARRIED
1.1/ 100
METRIC RATING
233rd/ 347
METRIC RANK
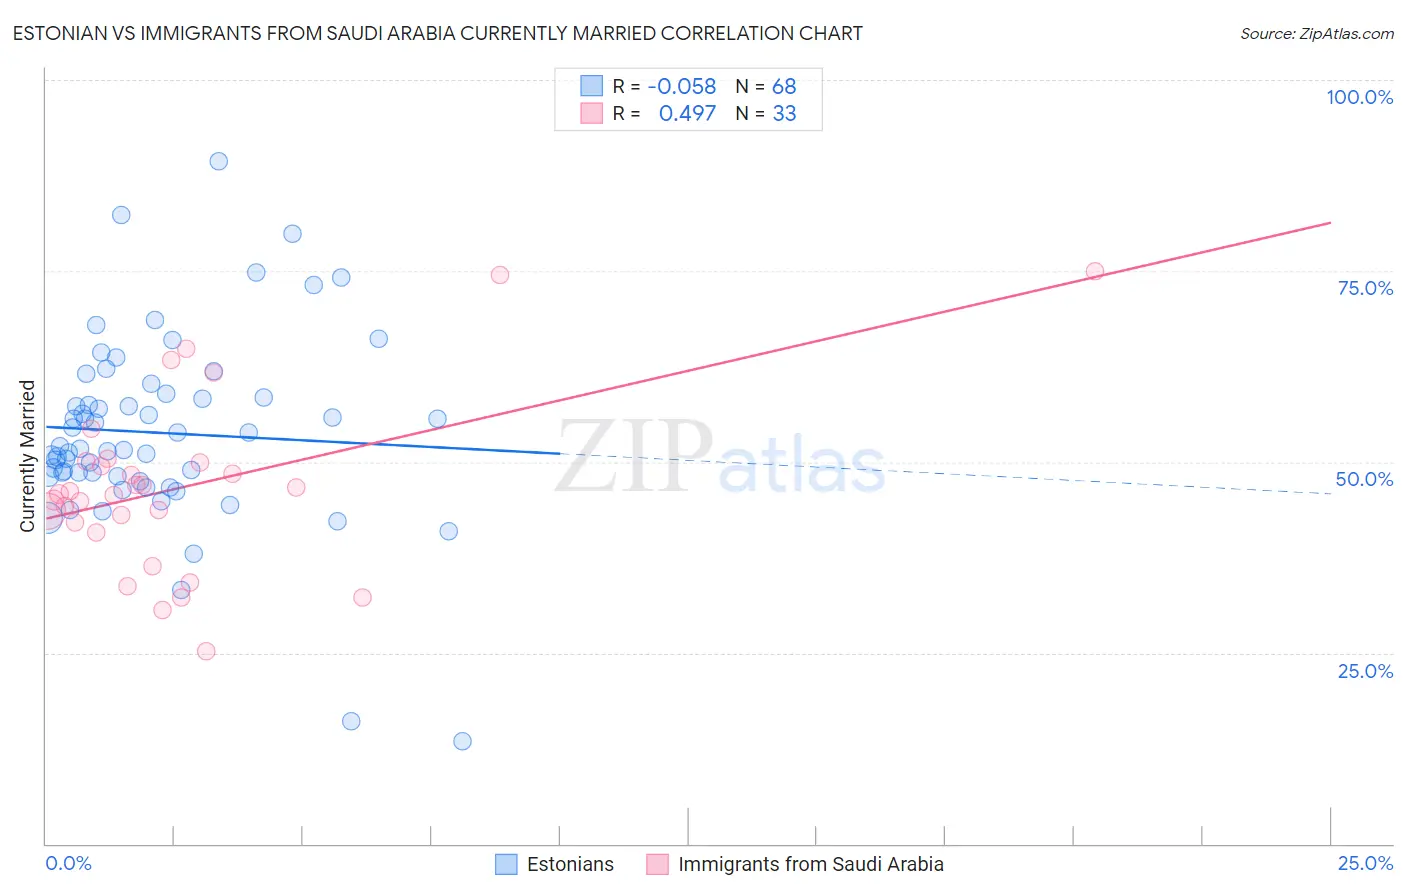
Estonian vs Immigrants from Saudi Arabia Currently Married Correlation Chart
The statistical analysis conducted on geographies consisting of 123,509,767 people shows a slight negative correlation between the proportion of Estonians and percentage of population currently married in the United States with a correlation coefficient (R) of -0.058 and weighted average of 48.2%. Similarly, the statistical analysis conducted on geographies consisting of 164,277,877 people shows a moderate positive correlation between the proportion of Immigrants from Saudi Arabia and percentage of population currently married in the United States with a correlation coefficient (R) of 0.497 and weighted average of 44.7%, a difference of 7.7%.
Currently Married Correlation Summary
| Measurement | Estonian | Immigrants from Saudi Arabia |
| Minimum | 13.5% | 25.2% |
| Maximum | 89.3% | 75.0% |
| Range | 75.8% | 49.8% |
| Mean | 53.8% | 46.7% |
| Median | 51.9% | 45.8% |
| Interquartile 25% (IQ1) | 48.1% | 41.4% |
| Interquartile 75% (IQ3) | 58.7% | 50.1% |
| Interquartile Range (IQR) | 10.6% | 8.7% |
| Standard Deviation (Sample) | 12.4% | 11.4% |
| Standard Deviation (Population) | 12.3% | 11.3% |
Similar Demographics by Currently Married
Demographics Similar to Estonians by Currently Married
In terms of currently married, the demographic groups most similar to Estonians are Immigrants from Eastern Asia (48.2%, a difference of 0.030%), Immigrants from Lebanon (48.2%, a difference of 0.050%), Immigrants from Belarus (48.1%, a difference of 0.070%), Basque (48.1%, a difference of 0.090%), and Slovene (48.1%, a difference of 0.11%).
| Demographics | Rating | Rank | Currently Married |
| Slovaks | 98.2 /100 | #67 | Exceptional 48.3% |
| Immigrants | England | 98.2 /100 | #68 | Exceptional 48.3% |
| Canadians | 98.1 /100 | #69 | Exceptional 48.3% |
| Immigrants | Asia | 97.9 /100 | #70 | Exceptional 48.3% |
| Macedonians | 97.9 /100 | #71 | Exceptional 48.3% |
| Immigrants | Lebanon | 97.6 /100 | #72 | Exceptional 48.2% |
| Immigrants | Eastern Asia | 97.5 /100 | #73 | Exceptional 48.2% |
| Estonians | 97.4 /100 | #74 | Exceptional 48.2% |
| Immigrants | Belarus | 97.2 /100 | #75 | Exceptional 48.1% |
| Basques | 97.2 /100 | #76 | Exceptional 48.1% |
| Slovenes | 97.1 /100 | #77 | Exceptional 48.1% |
| Immigrants | Belgium | 97.1 /100 | #78 | Exceptional 48.1% |
| Immigrants | South Africa | 97.0 /100 | #79 | Exceptional 48.1% |
| Immigrants | Poland | 96.9 /100 | #80 | Exceptional 48.1% |
| Immigrants | Sri Lanka | 96.9 /100 | #81 | Exceptional 48.1% |
Demographics Similar to Immigrants from Saudi Arabia by Currently Married
In terms of currently married, the demographic groups most similar to Immigrants from Saudi Arabia are Iroquois (44.7%, a difference of 0.010%), Nepalese (44.7%, a difference of 0.050%), Alaskan Athabascan (44.6%, a difference of 0.16%), Cuban (44.6%, a difference of 0.17%), and Seminole (44.6%, a difference of 0.18%).
| Demographics | Rating | Rank | Currently Married |
| Comanche | 2.1 /100 | #226 | Tragic 45.0% |
| Spanish Americans | 2.1 /100 | #227 | Tragic 45.0% |
| Immigrants | Uruguay | 2.0 /100 | #228 | Tragic 45.0% |
| Cree | 1.7 /100 | #229 | Tragic 44.9% |
| Immigrants | Kenya | 1.6 /100 | #230 | Tragic 44.9% |
| Immigrants | Panama | 1.5 /100 | #231 | Tragic 44.9% |
| Nepalese | 1.2 /100 | #232 | Tragic 44.7% |
| Immigrants | Saudi Arabia | 1.1 /100 | #233 | Tragic 44.7% |
| Iroquois | 1.1 /100 | #234 | Tragic 44.7% |
| Alaskan Athabascans | 0.9 /100 | #235 | Tragic 44.6% |
| Cubans | 0.9 /100 | #236 | Tragic 44.6% |
| Seminole | 0.9 /100 | #237 | Tragic 44.6% |
| Moroccans | 0.9 /100 | #238 | Tragic 44.6% |
| Immigrants | Mexico | 0.7 /100 | #239 | Tragic 44.5% |
| Mexican American Indians | 0.7 /100 | #240 | Tragic 44.5% |