Luxembourger vs British West Indian Divorced or Separated
COMPARE
Luxembourger
British West Indian
Divorced or Separated
Divorced or Separated Comparison
Luxembourgers
British West Indians
11.3%
DIVORCED OR SEPARATED
99.9/ 100
METRIC RATING
62nd/ 347
METRIC RANK
12.4%
DIVORCED OR SEPARATED
3.7/ 100
METRIC RATING
240th/ 347
METRIC RANK
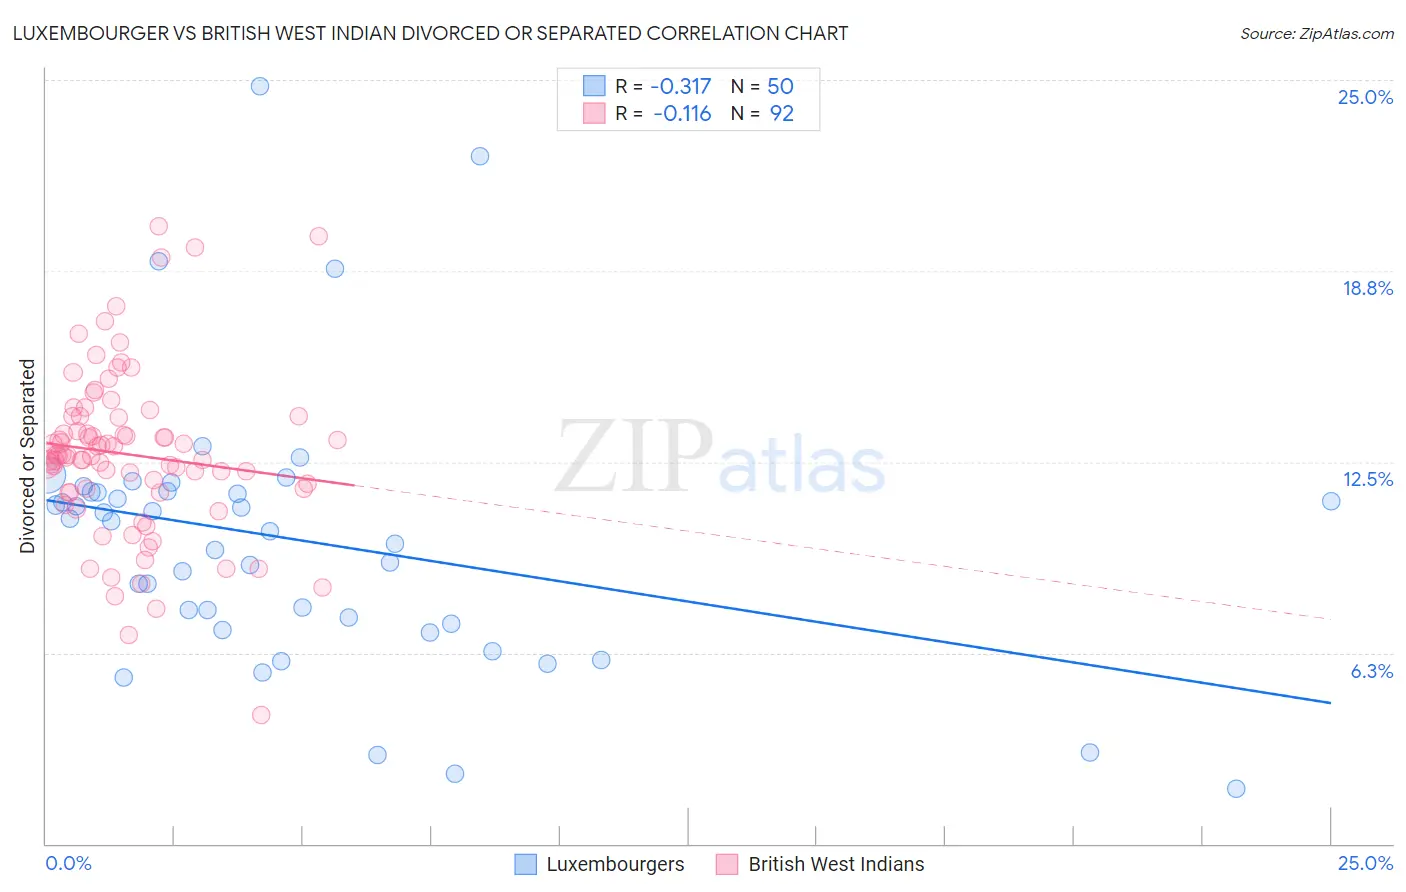
Luxembourger vs British West Indian Divorced or Separated Correlation Chart
The statistical analysis conducted on geographies consisting of 144,652,195 people shows a mild negative correlation between the proportion of Luxembourgers and percentage of population currently divorced or separated in the United States with a correlation coefficient (R) of -0.317 and weighted average of 11.3%. Similarly, the statistical analysis conducted on geographies consisting of 152,631,301 people shows a poor negative correlation between the proportion of British West Indians and percentage of population currently divorced or separated in the United States with a correlation coefficient (R) of -0.116 and weighted average of 12.4%, a difference of 9.2%.
Divorced or Separated Correlation Summary
| Measurement | Luxembourger | British West Indian |
| Minimum | 1.8% | 4.2% |
| Maximum | 24.8% | 20.2% |
| Range | 23.0% | 16.0% |
| Mean | 9.9% | 12.7% |
| Median | 10.4% | 12.7% |
| Interquartile 25% (IQ1) | 7.2% | 11.6% |
| Interquartile 75% (IQ3) | 11.5% | 14.0% |
| Interquartile Range (IQR) | 4.3% | 2.4% |
| Standard Deviation (Sample) | 4.5% | 2.7% |
| Standard Deviation (Population) | 4.4% | 2.7% |
Similar Demographics by Divorced or Separated
Demographics Similar to Luxembourgers by Divorced or Separated
In terms of divorced or separated, the demographic groups most similar to Luxembourgers are Korean (11.3%, a difference of 0.0%), Immigrants from Russia (11.3%, a difference of 0.010%), Immigrants from Kuwait (11.3%, a difference of 0.010%), Israeli (11.3%, a difference of 0.17%), and Sri Lankan (11.3%, a difference of 0.27%).
| Demographics | Rating | Rank | Divorced or Separated |
| Immigrants | Yemen | 99.9 /100 | #55 | Exceptional 11.3% |
| Immigrants | Philippines | 99.9 /100 | #56 | Exceptional 11.3% |
| Immigrants | Vietnam | 99.9 /100 | #57 | Exceptional 11.3% |
| Sri Lankans | 99.9 /100 | #58 | Exceptional 11.3% |
| Israelis | 99.9 /100 | #59 | Exceptional 11.3% |
| Immigrants | Russia | 99.9 /100 | #60 | Exceptional 11.3% |
| Koreans | 99.9 /100 | #61 | Exceptional 11.3% |
| Luxembourgers | 99.9 /100 | #62 | Exceptional 11.3% |
| Immigrants | Kuwait | 99.9 /100 | #63 | Exceptional 11.3% |
| Macedonians | 99.8 /100 | #64 | Exceptional 11.4% |
| Immigrants | South Eastern Asia | 99.8 /100 | #65 | Exceptional 11.4% |
| Inupiat | 99.8 /100 | #66 | Exceptional 11.4% |
| Immigrants | Syria | 99.7 /100 | #67 | Exceptional 11.4% |
| Palestinians | 99.7 /100 | #68 | Exceptional 11.5% |
| Immigrants | Belgium | 99.7 /100 | #69 | Exceptional 11.5% |
Demographics Similar to British West Indians by Divorced or Separated
In terms of divorced or separated, the demographic groups most similar to British West Indians are Immigrants from Germany (12.4%, a difference of 0.050%), Sudanese (12.4%, a difference of 0.060%), Immigrants from Laos (12.4%, a difference of 0.090%), Uruguayan (12.4%, a difference of 0.090%), and Colombian (12.4%, a difference of 0.10%).
| Demographics | Rating | Rank | Divorced or Separated |
| Malaysians | 4.8 /100 | #233 | Tragic 12.4% |
| West Indians | 4.4 /100 | #234 | Tragic 12.4% |
| Immigrants | Bosnia and Herzegovina | 4.3 /100 | #235 | Tragic 12.4% |
| Colombians | 4.2 /100 | #236 | Tragic 12.4% |
| Immigrants | Laos | 4.2 /100 | #237 | Tragic 12.4% |
| Sudanese | 4.0 /100 | #238 | Tragic 12.4% |
| Immigrants | Germany | 4.0 /100 | #239 | Tragic 12.4% |
| British West Indians | 3.7 /100 | #240 | Tragic 12.4% |
| Uruguayans | 3.4 /100 | #241 | Tragic 12.4% |
| Dutch | 3.1 /100 | #242 | Tragic 12.4% |
| Immigrants | Latin America | 2.8 /100 | #243 | Tragic 12.4% |
| Alaska Natives | 2.5 /100 | #244 | Tragic 12.4% |
| Hispanics or Latinos | 2.0 /100 | #245 | Tragic 12.5% |
| Immigrants | West Indies | 1.9 /100 | #246 | Tragic 12.5% |
| Germans | 1.8 /100 | #247 | Tragic 12.5% |