Japanese vs British West Indian Divorced or Separated
COMPARE
Japanese
British West Indian
Divorced or Separated
Divorced or Separated Comparison
Japanese
British West Indians
12.0%
DIVORCED OR SEPARATED
70.9/ 100
METRIC RATING
155th/ 347
METRIC RANK
12.4%
DIVORCED OR SEPARATED
3.7/ 100
METRIC RATING
240th/ 347
METRIC RANK
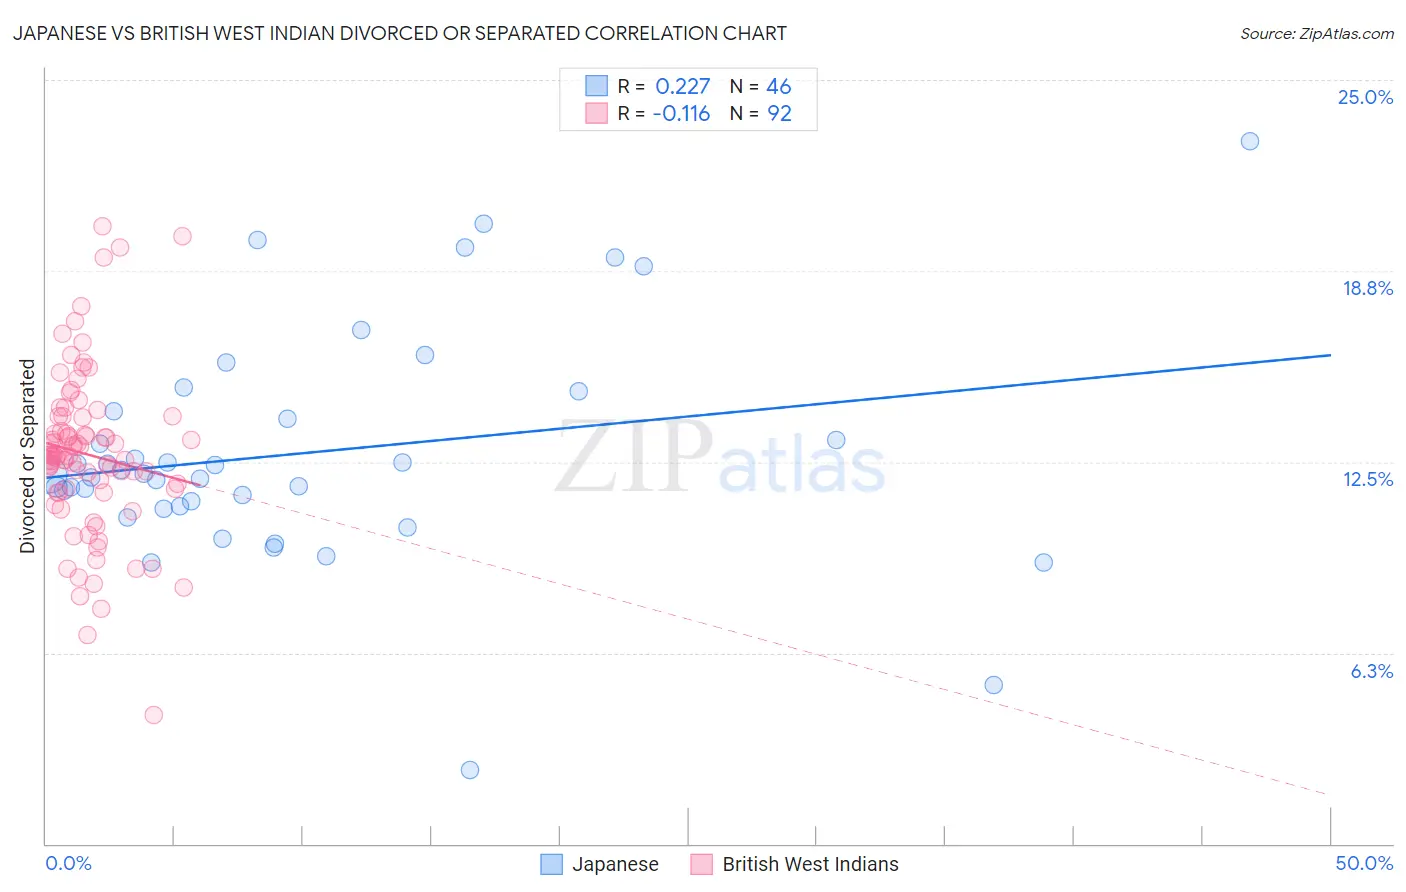
Japanese vs British West Indian Divorced or Separated Correlation Chart
The statistical analysis conducted on geographies consisting of 249,125,963 people shows a weak positive correlation between the proportion of Japanese and percentage of population currently divorced or separated in the United States with a correlation coefficient (R) of 0.227 and weighted average of 12.0%. Similarly, the statistical analysis conducted on geographies consisting of 152,631,301 people shows a poor negative correlation between the proportion of British West Indians and percentage of population currently divorced or separated in the United States with a correlation coefficient (R) of -0.116 and weighted average of 12.4%, a difference of 3.6%.
Divorced or Separated Correlation Summary
| Measurement | Japanese | British West Indian |
| Minimum | 2.4% | 4.2% |
| Maximum | 23.0% | 20.2% |
| Range | 20.6% | 16.0% |
| Mean | 12.8% | 12.7% |
| Median | 12.1% | 12.7% |
| Interquartile 25% (IQ1) | 11.1% | 11.6% |
| Interquartile 75% (IQ3) | 14.1% | 14.0% |
| Interquartile Range (IQR) | 3.1% | 2.4% |
| Standard Deviation (Sample) | 3.8% | 2.7% |
| Standard Deviation (Population) | 3.7% | 2.7% |
Similar Demographics by Divorced or Separated
Demographics Similar to Japanese by Divorced or Separated
In terms of divorced or separated, the demographic groups most similar to Japanese are Chilean (12.0%, a difference of 0.020%), Hungarian (12.0%, a difference of 0.020%), Austrian (12.0%, a difference of 0.060%), Immigrants from Brazil (12.0%, a difference of 0.090%), and Immigrants from Hungary (11.9%, a difference of 0.12%).
| Demographics | Rating | Rank | Divorced or Separated |
| Italians | 77.8 /100 | #148 | Good 11.9% |
| Immigrants | Oceania | 77.7 /100 | #149 | Good 11.9% |
| Immigrants | Portugal | 77.3 /100 | #150 | Good 11.9% |
| Czechs | 76.4 /100 | #151 | Good 11.9% |
| Immigrants | Hungary | 73.7 /100 | #152 | Good 11.9% |
| Austrians | 72.2 /100 | #153 | Good 12.0% |
| Chileans | 71.3 /100 | #154 | Good 12.0% |
| Japanese | 70.9 /100 | #155 | Good 12.0% |
| Hungarians | 70.3 /100 | #156 | Good 12.0% |
| Immigrants | Brazil | 68.8 /100 | #157 | Good 12.0% |
| Icelanders | 66.0 /100 | #158 | Good 12.0% |
| Immigrants | Barbados | 66.0 /100 | #159 | Good 12.0% |
| Immigrants | Scotland | 65.8 /100 | #160 | Good 12.0% |
| Marshallese | 64.6 /100 | #161 | Good 12.0% |
| Samoans | 64.3 /100 | #162 | Good 12.0% |
Demographics Similar to British West Indians by Divorced or Separated
In terms of divorced or separated, the demographic groups most similar to British West Indians are Immigrants from Germany (12.4%, a difference of 0.050%), Sudanese (12.4%, a difference of 0.060%), Immigrants from Laos (12.4%, a difference of 0.090%), Uruguayan (12.4%, a difference of 0.090%), and Colombian (12.4%, a difference of 0.10%).
| Demographics | Rating | Rank | Divorced or Separated |
| Malaysians | 4.8 /100 | #233 | Tragic 12.4% |
| West Indians | 4.4 /100 | #234 | Tragic 12.4% |
| Immigrants | Bosnia and Herzegovina | 4.3 /100 | #235 | Tragic 12.4% |
| Colombians | 4.2 /100 | #236 | Tragic 12.4% |
| Immigrants | Laos | 4.2 /100 | #237 | Tragic 12.4% |
| Sudanese | 4.0 /100 | #238 | Tragic 12.4% |
| Immigrants | Germany | 4.0 /100 | #239 | Tragic 12.4% |
| British West Indians | 3.7 /100 | #240 | Tragic 12.4% |
| Uruguayans | 3.4 /100 | #241 | Tragic 12.4% |
| Dutch | 3.1 /100 | #242 | Tragic 12.4% |
| Immigrants | Latin America | 2.8 /100 | #243 | Tragic 12.4% |
| Alaska Natives | 2.5 /100 | #244 | Tragic 12.4% |
| Hispanics or Latinos | 2.0 /100 | #245 | Tragic 12.5% |
| Immigrants | West Indies | 1.9 /100 | #246 | Tragic 12.5% |
| Germans | 1.8 /100 | #247 | Tragic 12.5% |