Belgian vs British West Indian Divorced or Separated
COMPARE
Belgian
British West Indian
Divorced or Separated
Divorced or Separated Comparison
Belgians
British West Indians
12.3%
DIVORCED OR SEPARATED
9.7/ 100
METRIC RATING
225th/ 347
METRIC RANK
12.4%
DIVORCED OR SEPARATED
3.7/ 100
METRIC RATING
240th/ 347
METRIC RANK
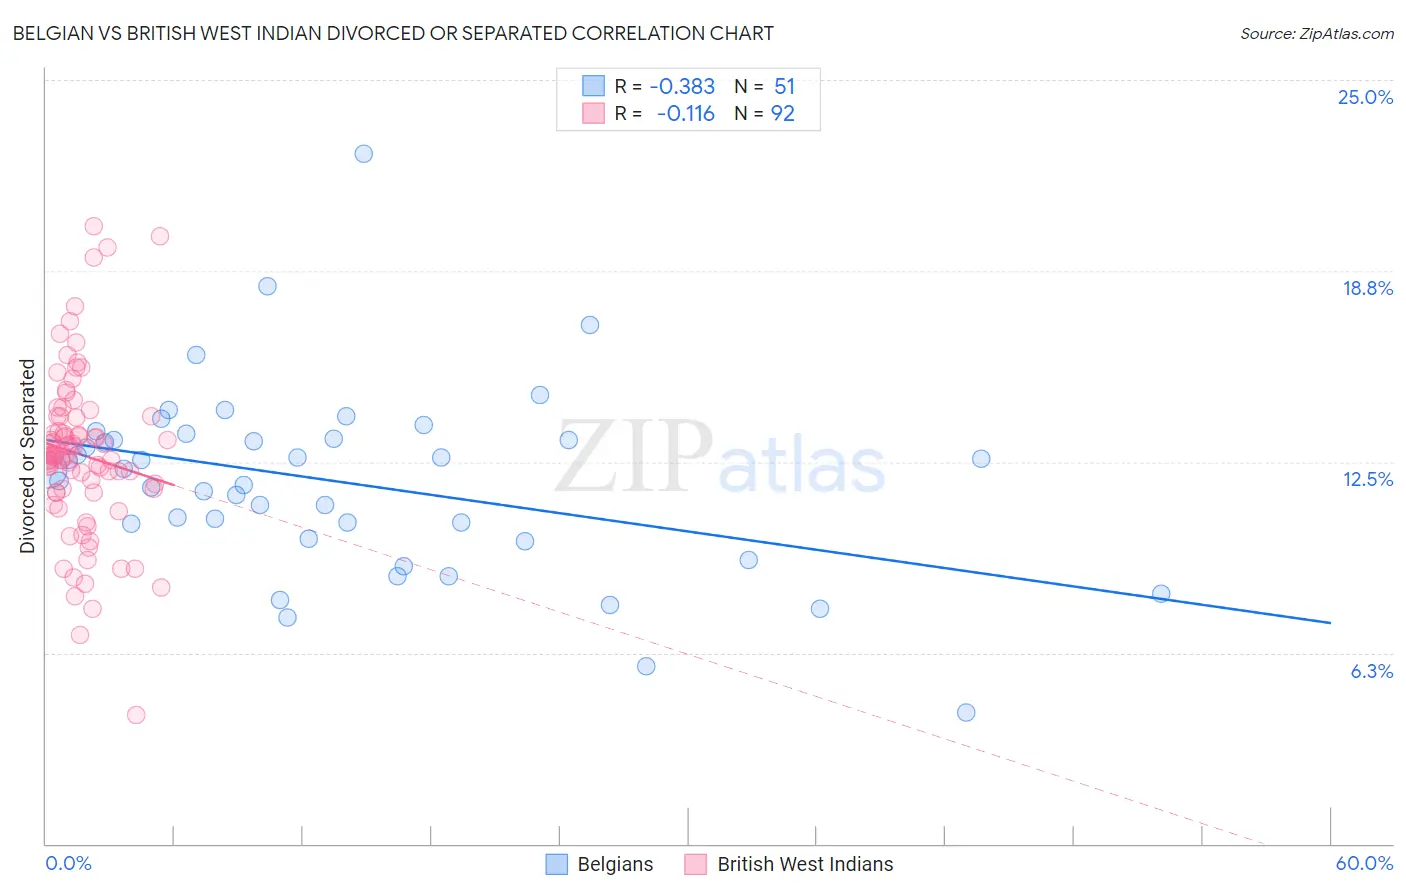
Belgian vs British West Indian Divorced or Separated Correlation Chart
The statistical analysis conducted on geographies consisting of 355,900,464 people shows a mild negative correlation between the proportion of Belgians and percentage of population currently divorced or separated in the United States with a correlation coefficient (R) of -0.383 and weighted average of 12.3%. Similarly, the statistical analysis conducted on geographies consisting of 152,631,301 people shows a poor negative correlation between the proportion of British West Indians and percentage of population currently divorced or separated in the United States with a correlation coefficient (R) of -0.116 and weighted average of 12.4%, a difference of 0.86%.
Divorced or Separated Correlation Summary
| Measurement | Belgian | British West Indian |
| Minimum | 4.3% | 4.2% |
| Maximum | 22.6% | 20.2% |
| Range | 18.3% | 16.0% |
| Mean | 11.8% | 12.7% |
| Median | 12.2% | 12.7% |
| Interquartile 25% (IQ1) | 10.0% | 11.6% |
| Interquartile 75% (IQ3) | 13.2% | 14.0% |
| Interquartile Range (IQR) | 3.3% | 2.4% |
| Standard Deviation (Sample) | 3.1% | 2.7% |
| Standard Deviation (Population) | 3.1% | 2.7% |
Demographics Similar to Belgians and British West Indians by Divorced or Separated
In terms of divorced or separated, the demographic groups most similar to Belgians are Immigrants from the Azores (12.3%, a difference of 0.0%), Immigrants from Western Africa (12.3%, a difference of 0.030%), Scandinavian (12.3%, a difference of 0.070%), Bangladeshi (12.3%, a difference of 0.080%), and Hmong (12.3%, a difference of 0.090%). Similarly, the demographic groups most similar to British West Indians are Immigrants from Germany (12.4%, a difference of 0.050%), Sudanese (12.4%, a difference of 0.060%), Immigrants from Laos (12.4%, a difference of 0.090%), Uruguayan (12.4%, a difference of 0.090%), and Colombian (12.4%, a difference of 0.10%).
| Demographics | Rating | Rank | Divorced or Separated |
| Bangladeshis | 10.5 /100 | #222 | Poor 12.3% |
| Scandinavians | 10.4 /100 | #223 | Poor 12.3% |
| Immigrants | Azores | 9.7 /100 | #224 | Tragic 12.3% |
| Belgians | 9.7 /100 | #225 | Tragic 12.3% |
| Immigrants | Western Africa | 9.3 /100 | #226 | Tragic 12.3% |
| Hmong | 8.8 /100 | #227 | Tragic 12.3% |
| Immigrants | Cameroon | 8.3 /100 | #228 | Tragic 12.3% |
| Immigrants | Sudan | 8.2 /100 | #229 | Tragic 12.3% |
| Yakama | 7.8 /100 | #230 | Tragic 12.3% |
| Yugoslavians | 6.6 /100 | #231 | Tragic 12.3% |
| Canadians | 5.3 /100 | #232 | Tragic 12.4% |
| Malaysians | 4.8 /100 | #233 | Tragic 12.4% |
| West Indians | 4.4 /100 | #234 | Tragic 12.4% |
| Immigrants | Bosnia and Herzegovina | 4.3 /100 | #235 | Tragic 12.4% |
| Colombians | 4.2 /100 | #236 | Tragic 12.4% |
| Immigrants | Laos | 4.2 /100 | #237 | Tragic 12.4% |
| Sudanese | 4.0 /100 | #238 | Tragic 12.4% |
| Immigrants | Germany | 4.0 /100 | #239 | Tragic 12.4% |
| British West Indians | 3.7 /100 | #240 | Tragic 12.4% |
| Uruguayans | 3.4 /100 | #241 | Tragic 12.4% |
| Dutch | 3.1 /100 | #242 | Tragic 12.4% |