Estonian vs Immigrants from Hong Kong Family Households
COMPARE
Estonian
Immigrants from Hong Kong
Family Households
Family Households Comparison
Estonians
Immigrants from Hong Kong
62.9%
FAMILY HOUSEHOLDS
0.2/ 100
METRIC RATING
281st/ 347
METRIC RANK
66.1%
FAMILY HOUSEHOLDS
100.0/ 100
METRIC RATING
56th/ 347
METRIC RANK
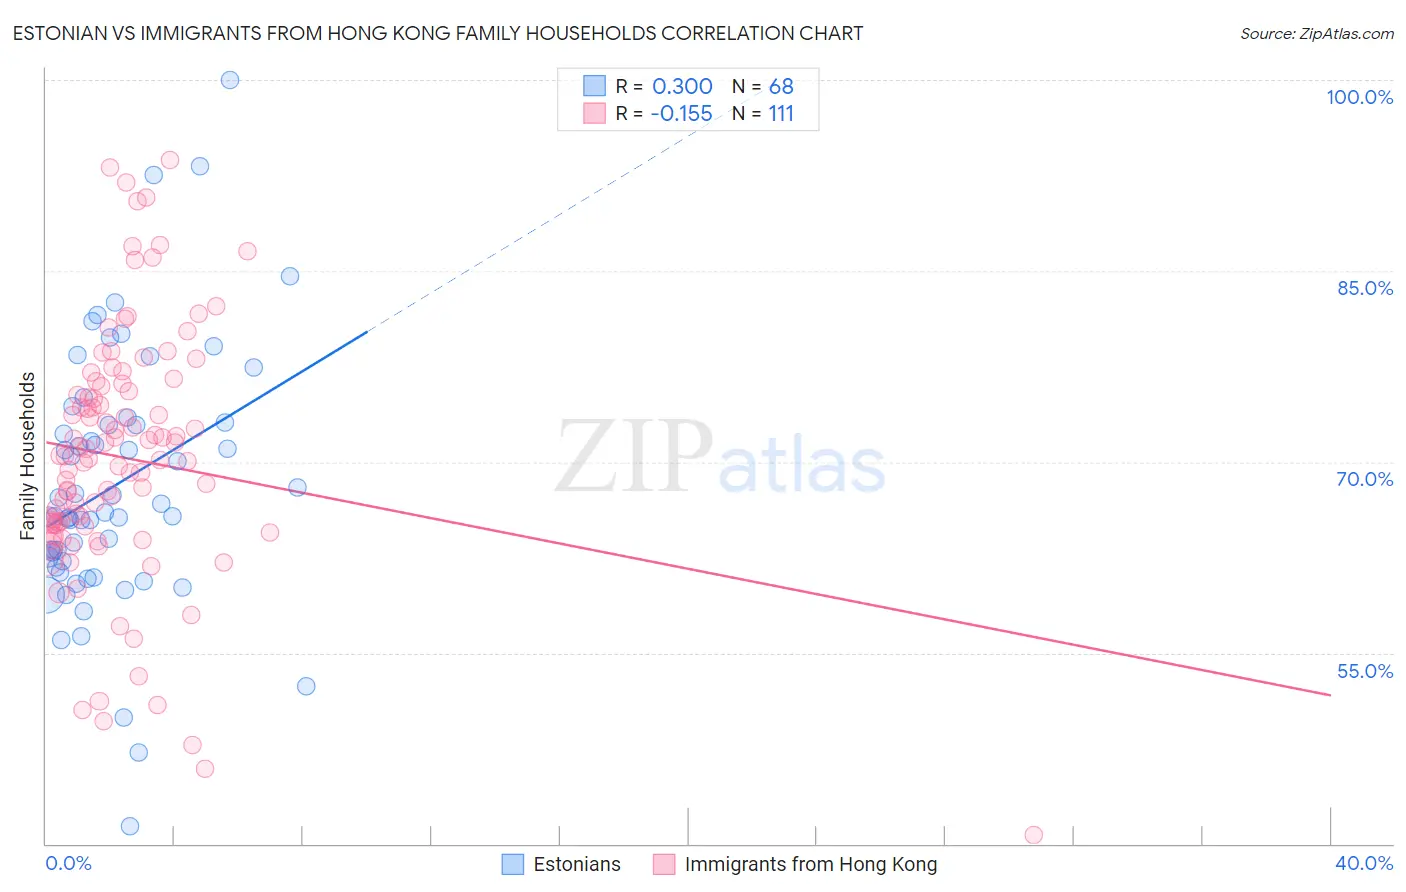
Estonian vs Immigrants from Hong Kong Family Households Correlation Chart
The statistical analysis conducted on geographies consisting of 123,500,742 people shows a weak positive correlation between the proportion of Estonians and percentage of family households in the United States with a correlation coefficient (R) of 0.300 and weighted average of 62.9%. Similarly, the statistical analysis conducted on geographies consisting of 253,896,995 people shows a poor negative correlation between the proportion of Immigrants from Hong Kong and percentage of family households in the United States with a correlation coefficient (R) of -0.155 and weighted average of 66.1%, a difference of 5.2%.
Family Households Correlation Summary
| Measurement | Estonian | Immigrants from Hong Kong |
| Minimum | 41.3% | 40.7% |
| Maximum | 100.0% | 93.8% |
| Range | 58.7% | 53.1% |
| Mean | 68.1% | 70.3% |
| Median | 65.9% | 70.5% |
| Interquartile 25% (IQ1) | 61.9% | 65.1% |
| Interquartile 75% (IQ3) | 73.0% | 75.9% |
| Interquartile Range (IQR) | 11.1% | 10.8% |
| Standard Deviation (Sample) | 10.2% | 9.9% |
| Standard Deviation (Population) | 10.2% | 9.9% |
Similar Demographics by Family Households
Demographics Similar to Estonians by Family Households
In terms of family households, the demographic groups most similar to Estonians are New Zealander (62.9%, a difference of 0.030%), Immigrants from Denmark (62.9%, a difference of 0.040%), Australian (62.8%, a difference of 0.080%), Immigrants from Bulgaria (63.0%, a difference of 0.090%), and Immigrants from Yemen (63.0%, a difference of 0.11%).
| Demographics | Rating | Rank | Family Households |
| Lumbee | 0.3 /100 | #274 | Tragic 63.1% |
| West Indians | 0.3 /100 | #275 | Tragic 63.1% |
| Serbians | 0.3 /100 | #276 | Tragic 63.0% |
| Ottawa | 0.3 /100 | #277 | Tragic 63.0% |
| Immigrants | Belgium | 0.2 /100 | #278 | Tragic 63.0% |
| Immigrants | Yemen | 0.2 /100 | #279 | Tragic 63.0% |
| Immigrants | Bulgaria | 0.2 /100 | #280 | Tragic 63.0% |
| Estonians | 0.2 /100 | #281 | Tragic 62.9% |
| New Zealanders | 0.1 /100 | #282 | Tragic 62.9% |
| Immigrants | Denmark | 0.1 /100 | #283 | Tragic 62.9% |
| Australians | 0.1 /100 | #284 | Tragic 62.8% |
| Mongolians | 0.1 /100 | #285 | Tragic 62.8% |
| British West Indians | 0.1 /100 | #286 | Tragic 62.8% |
| Latvians | 0.1 /100 | #287 | Tragic 62.8% |
| Immigrants | Uganda | 0.1 /100 | #288 | Tragic 62.7% |
Demographics Similar to Immigrants from Hong Kong by Family Households
In terms of family households, the demographic groups most similar to Immigrants from Hong Kong are Immigrants (66.1%, a difference of 0.010%), Pennsylvania German (66.1%, a difference of 0.020%), Immigrants from Asia (66.1%, a difference of 0.13%), Immigrants from Korea (66.0%, a difference of 0.15%), and South American (66.0%, a difference of 0.15%).
| Demographics | Rating | Rank | Family Households |
| Immigrants | South Central Asia | 100.0 /100 | #49 | Exceptional 66.4% |
| Navajo | 100.0 /100 | #50 | Exceptional 66.4% |
| Natives/Alaskans | 100.0 /100 | #51 | Exceptional 66.4% |
| Colombians | 100.0 /100 | #52 | Exceptional 66.3% |
| Afghans | 100.0 /100 | #53 | Exceptional 66.3% |
| Immigrants | Colombia | 100.0 /100 | #54 | Exceptional 66.3% |
| Immigrants | Immigrants | 100.0 /100 | #55 | Exceptional 66.1% |
| Immigrants | Hong Kong | 100.0 /100 | #56 | Exceptional 66.1% |
| Pennsylvania Germans | 100.0 /100 | #57 | Exceptional 66.1% |
| Immigrants | Asia | 100.0 /100 | #58 | Exceptional 66.1% |
| Immigrants | Korea | 100.0 /100 | #59 | Exceptional 66.0% |
| South Americans | 100.0 /100 | #60 | Exceptional 66.0% |
| Danes | 100.0 /100 | #61 | Exceptional 66.0% |
| Central Americans | 100.0 /100 | #62 | Exceptional 66.0% |
| Immigrants | Indonesia | 100.0 /100 | #63 | Exceptional 66.0% |