Estonian vs Immigrants from South Eastern Asia Family Households
COMPARE
Estonian
Immigrants from South Eastern Asia
Family Households
Family Households Comparison
Estonians
Immigrants from South Eastern Asia
62.9%
FAMILY HOUSEHOLDS
0.2/ 100
METRIC RATING
281st/ 347
METRIC RANK
67.5%
FAMILY HOUSEHOLDS
100.0/ 100
METRIC RATING
24th/ 347
METRIC RANK
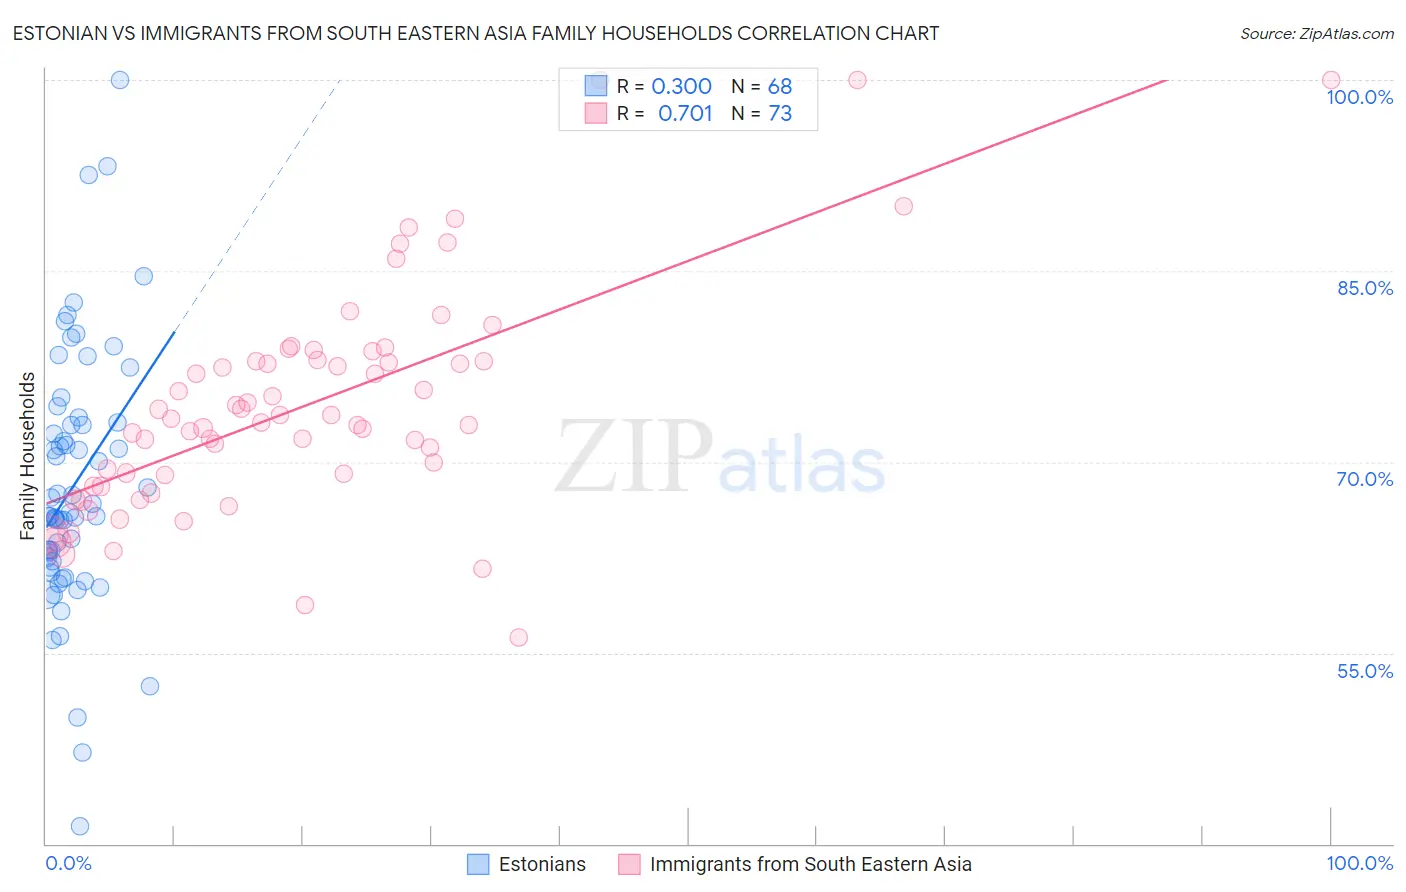
Estonian vs Immigrants from South Eastern Asia Family Households Correlation Chart
The statistical analysis conducted on geographies consisting of 123,500,742 people shows a weak positive correlation between the proportion of Estonians and percentage of family households in the United States with a correlation coefficient (R) of 0.300 and weighted average of 62.9%. Similarly, the statistical analysis conducted on geographies consisting of 512,232,151 people shows a strong positive correlation between the proportion of Immigrants from South Eastern Asia and percentage of family households in the United States with a correlation coefficient (R) of 0.701 and weighted average of 67.5%, a difference of 7.3%.
Family Households Correlation Summary
| Measurement | Estonian | Immigrants from South Eastern Asia |
| Minimum | 41.3% | 56.2% |
| Maximum | 100.0% | 100.0% |
| Range | 58.7% | 43.8% |
| Mean | 68.1% | 74.5% |
| Median | 65.9% | 73.4% |
| Interquartile 25% (IQ1) | 61.9% | 68.5% |
| Interquartile 75% (IQ3) | 73.0% | 78.0% |
| Interquartile Range (IQR) | 11.1% | 9.4% |
| Standard Deviation (Sample) | 10.2% | 8.8% |
| Standard Deviation (Population) | 10.2% | 8.7% |
Similar Demographics by Family Households
Demographics Similar to Estonians by Family Households
In terms of family households, the demographic groups most similar to Estonians are New Zealander (62.9%, a difference of 0.030%), Immigrants from Denmark (62.9%, a difference of 0.040%), Australian (62.8%, a difference of 0.080%), Immigrants from Bulgaria (63.0%, a difference of 0.090%), and Immigrants from Yemen (63.0%, a difference of 0.11%).
| Demographics | Rating | Rank | Family Households |
| Lumbee | 0.3 /100 | #274 | Tragic 63.1% |
| West Indians | 0.3 /100 | #275 | Tragic 63.1% |
| Serbians | 0.3 /100 | #276 | Tragic 63.0% |
| Ottawa | 0.3 /100 | #277 | Tragic 63.0% |
| Immigrants | Belgium | 0.2 /100 | #278 | Tragic 63.0% |
| Immigrants | Yemen | 0.2 /100 | #279 | Tragic 63.0% |
| Immigrants | Bulgaria | 0.2 /100 | #280 | Tragic 63.0% |
| Estonians | 0.2 /100 | #281 | Tragic 62.9% |
| New Zealanders | 0.1 /100 | #282 | Tragic 62.9% |
| Immigrants | Denmark | 0.1 /100 | #283 | Tragic 62.9% |
| Australians | 0.1 /100 | #284 | Tragic 62.8% |
| Mongolians | 0.1 /100 | #285 | Tragic 62.8% |
| British West Indians | 0.1 /100 | #286 | Tragic 62.8% |
| Latvians | 0.1 /100 | #287 | Tragic 62.8% |
| Immigrants | Uganda | 0.1 /100 | #288 | Tragic 62.7% |
Demographics Similar to Immigrants from South Eastern Asia by Family Households
In terms of family households, the demographic groups most similar to Immigrants from South Eastern Asia are Immigrants from Nicaragua (67.5%, a difference of 0.020%), Immigrants from India (67.4%, a difference of 0.040%), Hispanic or Latino (67.4%, a difference of 0.080%), Hawaiian (67.4%, a difference of 0.090%), and Nicaraguan (67.4%, a difference of 0.16%).
| Demographics | Rating | Rank | Family Households |
| Chinese | 100.0 /100 | #17 | Exceptional 68.1% |
| Immigrants | Taiwan | 100.0 /100 | #18 | Exceptional 68.0% |
| Samoans | 100.0 /100 | #19 | Exceptional 67.9% |
| Inupiat | 100.0 /100 | #20 | Exceptional 67.8% |
| Cubans | 100.0 /100 | #21 | Exceptional 67.7% |
| Sri Lankans | 100.0 /100 | #22 | Exceptional 67.7% |
| Immigrants | Pakistan | 100.0 /100 | #23 | Exceptional 67.7% |
| Immigrants | South Eastern Asia | 100.0 /100 | #24 | Exceptional 67.5% |
| Immigrants | Nicaragua | 100.0 /100 | #25 | Exceptional 67.5% |
| Immigrants | India | 100.0 /100 | #26 | Exceptional 67.4% |
| Hispanics or Latinos | 100.0 /100 | #27 | Exceptional 67.4% |
| Hawaiians | 100.0 /100 | #28 | Exceptional 67.4% |
| Nicaraguans | 100.0 /100 | #29 | Exceptional 67.4% |
| Immigrants | Peru | 100.0 /100 | #30 | Exceptional 67.2% |
| Immigrants | Latin America | 100.0 /100 | #31 | Exceptional 67.2% |