Hawaiian vs Immigrants from Hong Kong Family Households
COMPARE
Hawaiian
Immigrants from Hong Kong
Family Households
Family Households Comparison
Hawaiians
Immigrants from Hong Kong
67.4%
FAMILY HOUSEHOLDS
100.0/ 100
METRIC RATING
28th/ 347
METRIC RANK
66.1%
FAMILY HOUSEHOLDS
100.0/ 100
METRIC RATING
56th/ 347
METRIC RANK
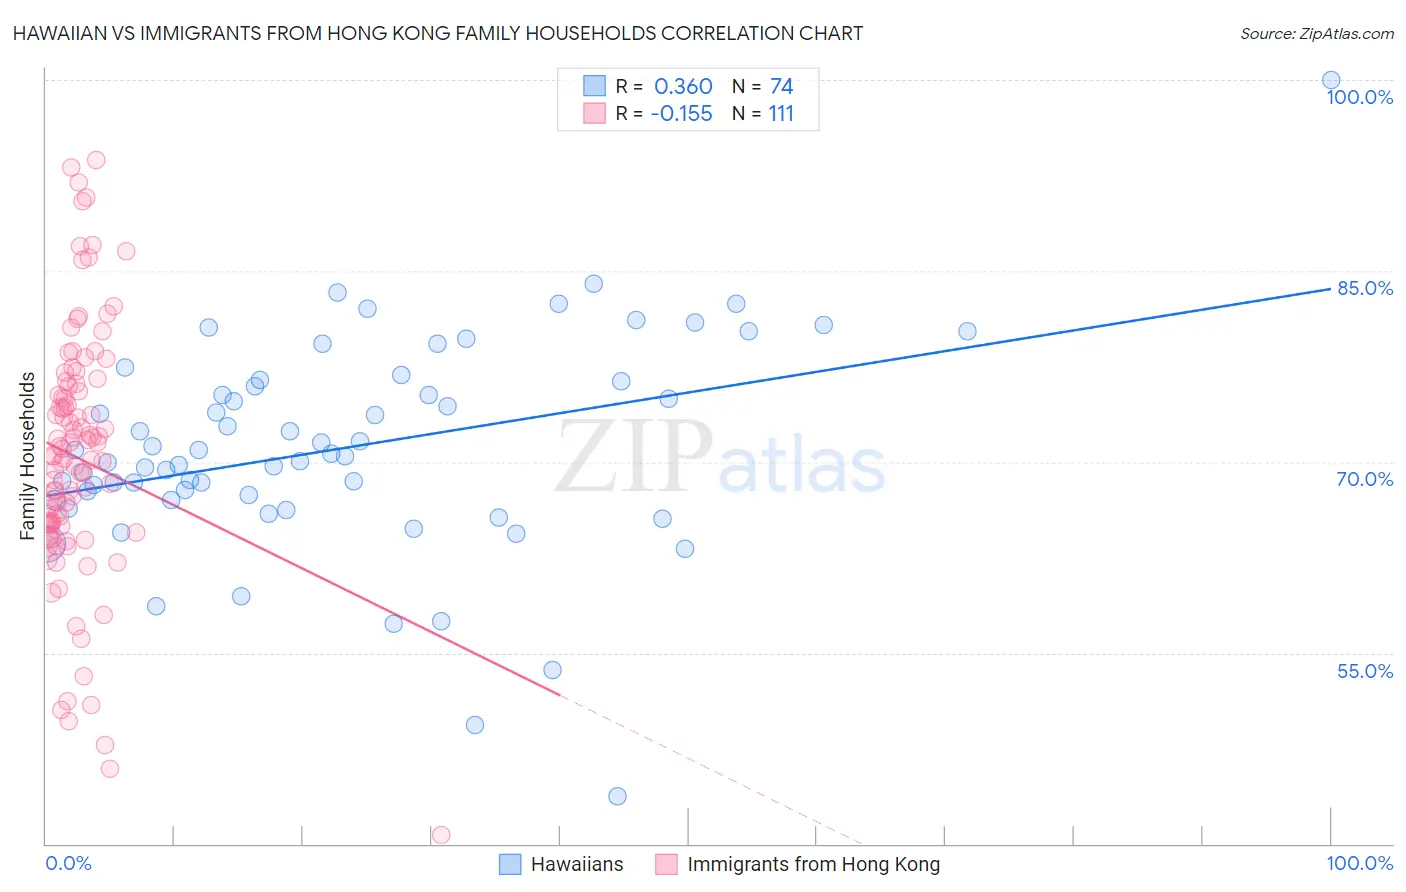
Hawaiian vs Immigrants from Hong Kong Family Households Correlation Chart
The statistical analysis conducted on geographies consisting of 327,392,617 people shows a mild positive correlation between the proportion of Hawaiians and percentage of family households in the United States with a correlation coefficient (R) of 0.360 and weighted average of 67.4%. Similarly, the statistical analysis conducted on geographies consisting of 253,896,995 people shows a poor negative correlation between the proportion of Immigrants from Hong Kong and percentage of family households in the United States with a correlation coefficient (R) of -0.155 and weighted average of 66.1%, a difference of 1.9%.
Family Households Correlation Summary
| Measurement | Hawaiian | Immigrants from Hong Kong |
| Minimum | 43.7% | 40.7% |
| Maximum | 100.0% | 93.8% |
| Range | 56.3% | 53.1% |
| Mean | 71.1% | 70.3% |
| Median | 70.5% | 70.5% |
| Interquartile 25% (IQ1) | 67.0% | 65.1% |
| Interquartile 75% (IQ3) | 76.4% | 75.9% |
| Interquartile Range (IQR) | 9.3% | 10.8% |
| Standard Deviation (Sample) | 8.5% | 9.9% |
| Standard Deviation (Population) | 8.4% | 9.9% |
Similar Demographics by Family Households
Demographics Similar to Hawaiians by Family Households
In terms of family households, the demographic groups most similar to Hawaiians are Hispanic or Latino (67.4%, a difference of 0.010%), Immigrants from India (67.4%, a difference of 0.060%), Immigrants from Nicaragua (67.5%, a difference of 0.070%), Nicaraguan (67.4%, a difference of 0.070%), and Immigrants from South Eastern Asia (67.5%, a difference of 0.090%).
| Demographics | Rating | Rank | Family Households |
| Cubans | 100.0 /100 | #21 | Exceptional 67.7% |
| Sri Lankans | 100.0 /100 | #22 | Exceptional 67.7% |
| Immigrants | Pakistan | 100.0 /100 | #23 | Exceptional 67.7% |
| Immigrants | South Eastern Asia | 100.0 /100 | #24 | Exceptional 67.5% |
| Immigrants | Nicaragua | 100.0 /100 | #25 | Exceptional 67.5% |
| Immigrants | India | 100.0 /100 | #26 | Exceptional 67.4% |
| Hispanics or Latinos | 100.0 /100 | #27 | Exceptional 67.4% |
| Hawaiians | 100.0 /100 | #28 | Exceptional 67.4% |
| Nicaraguans | 100.0 /100 | #29 | Exceptional 67.4% |
| Immigrants | Peru | 100.0 /100 | #30 | Exceptional 67.2% |
| Immigrants | Latin America | 100.0 /100 | #31 | Exceptional 67.2% |
| Nepalese | 100.0 /100 | #32 | Exceptional 67.2% |
| Salvadorans | 100.0 /100 | #33 | Exceptional 67.2% |
| Thais | 100.0 /100 | #34 | Exceptional 67.2% |
| Tohono O'odham | 100.0 /100 | #35 | Exceptional 67.1% |
Demographics Similar to Immigrants from Hong Kong by Family Households
In terms of family households, the demographic groups most similar to Immigrants from Hong Kong are Immigrants (66.1%, a difference of 0.010%), Pennsylvania German (66.1%, a difference of 0.020%), Immigrants from Asia (66.1%, a difference of 0.13%), Immigrants from Korea (66.0%, a difference of 0.15%), and South American (66.0%, a difference of 0.15%).
| Demographics | Rating | Rank | Family Households |
| Immigrants | South Central Asia | 100.0 /100 | #49 | Exceptional 66.4% |
| Navajo | 100.0 /100 | #50 | Exceptional 66.4% |
| Natives/Alaskans | 100.0 /100 | #51 | Exceptional 66.4% |
| Colombians | 100.0 /100 | #52 | Exceptional 66.3% |
| Afghans | 100.0 /100 | #53 | Exceptional 66.3% |
| Immigrants | Colombia | 100.0 /100 | #54 | Exceptional 66.3% |
| Immigrants | Immigrants | 100.0 /100 | #55 | Exceptional 66.1% |
| Immigrants | Hong Kong | 100.0 /100 | #56 | Exceptional 66.1% |
| Pennsylvania Germans | 100.0 /100 | #57 | Exceptional 66.1% |
| Immigrants | Asia | 100.0 /100 | #58 | Exceptional 66.1% |
| Immigrants | Korea | 100.0 /100 | #59 | Exceptional 66.0% |
| South Americans | 100.0 /100 | #60 | Exceptional 66.0% |
| Danes | 100.0 /100 | #61 | Exceptional 66.0% |
| Central Americans | 100.0 /100 | #62 | Exceptional 66.0% |
| Immigrants | Indonesia | 100.0 /100 | #63 | Exceptional 66.0% |