Comanche vs Immigrants from Hong Kong Family Households
COMPARE
Comanche
Immigrants from Hong Kong
Family Households
Family Households Comparison
Comanche
Immigrants from Hong Kong
63.5%
FAMILY HOUSEHOLDS
2.1/ 100
METRIC RATING
237th/ 347
METRIC RANK
66.1%
FAMILY HOUSEHOLDS
100.0/ 100
METRIC RATING
56th/ 347
METRIC RANK
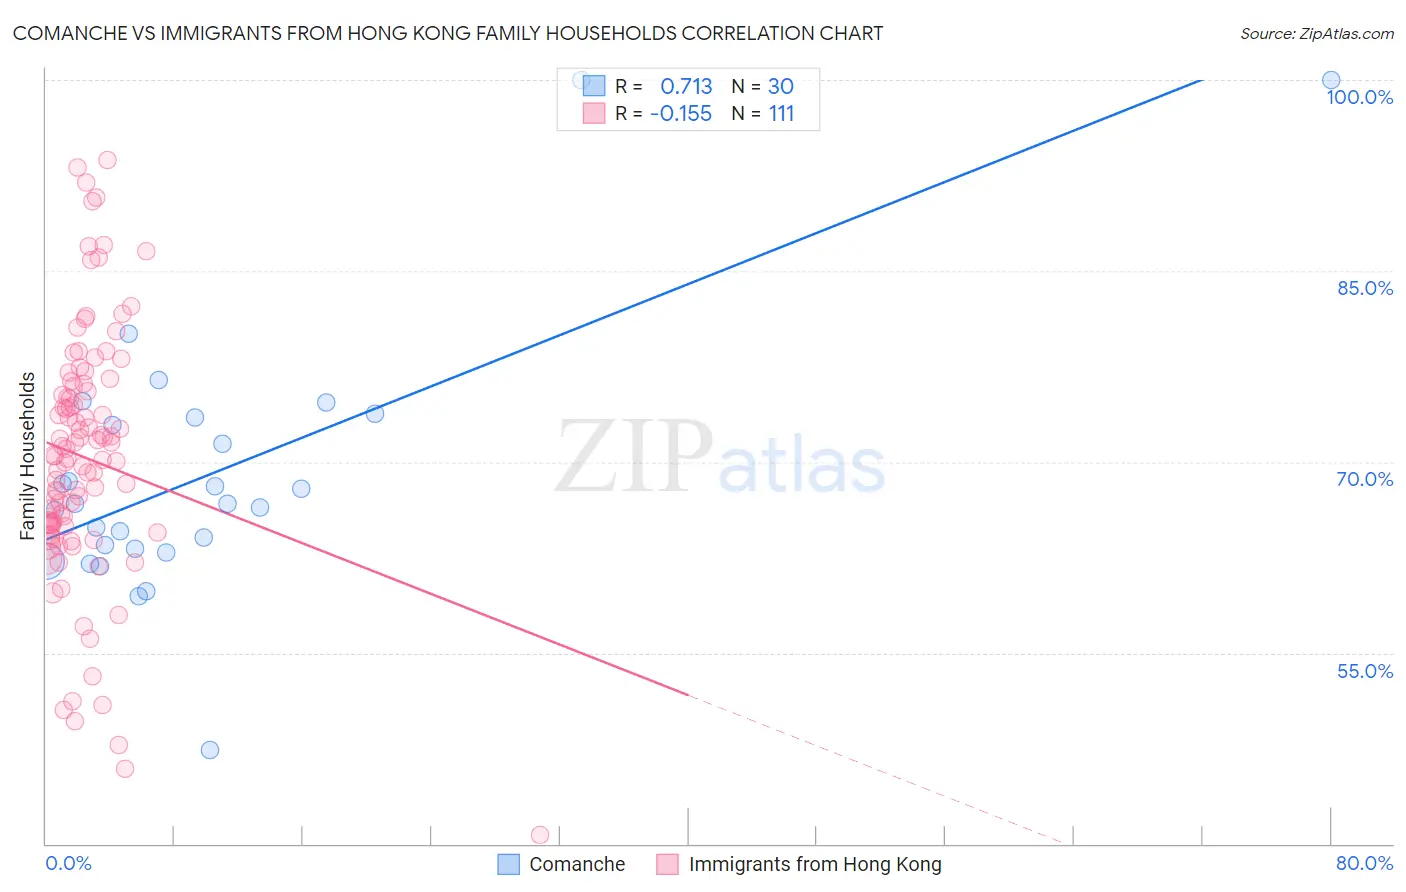
Comanche vs Immigrants from Hong Kong Family Households Correlation Chart
The statistical analysis conducted on geographies consisting of 109,767,909 people shows a strong positive correlation between the proportion of Comanche and percentage of family households in the United States with a correlation coefficient (R) of 0.713 and weighted average of 63.5%. Similarly, the statistical analysis conducted on geographies consisting of 253,896,995 people shows a poor negative correlation between the proportion of Immigrants from Hong Kong and percentage of family households in the United States with a correlation coefficient (R) of -0.155 and weighted average of 66.1%, a difference of 4.2%.
Family Households Correlation Summary
| Measurement | Comanche | Immigrants from Hong Kong |
| Minimum | 47.4% | 40.7% |
| Maximum | 100.0% | 93.8% |
| Range | 52.6% | 53.1% |
| Mean | 69.1% | 70.3% |
| Median | 66.7% | 70.5% |
| Interquartile 25% (IQ1) | 63.2% | 65.1% |
| Interquartile 75% (IQ3) | 73.4% | 75.9% |
| Interquartile Range (IQR) | 10.3% | 10.8% |
| Standard Deviation (Sample) | 10.5% | 9.9% |
| Standard Deviation (Population) | 10.3% | 9.9% |
Similar Demographics by Family Households
Demographics Similar to Comanche by Family Households
In terms of family households, the demographic groups most similar to Comanche are Ghanaian (63.5%, a difference of 0.0%), Immigrants from Zimbabwe (63.5%, a difference of 0.010%), Albanian (63.5%, a difference of 0.020%), Aleut (63.4%, a difference of 0.030%), and South African (63.4%, a difference of 0.030%).
| Demographics | Rating | Rank | Family Households |
| Immigrants | Brazil | 3.0 /100 | #230 | Tragic 63.6% |
| Immigrants | Greece | 2.9 /100 | #231 | Tragic 63.5% |
| Immigrants | Northern Africa | 2.6 /100 | #232 | Tragic 63.5% |
| Immigrants | Armenia | 2.6 /100 | #233 | Tragic 63.5% |
| Finns | 2.3 /100 | #234 | Tragic 63.5% |
| Albanians | 2.2 /100 | #235 | Tragic 63.5% |
| Ghanaians | 2.1 /100 | #236 | Tragic 63.5% |
| Comanche | 2.1 /100 | #237 | Tragic 63.5% |
| Immigrants | Zimbabwe | 2.0 /100 | #238 | Tragic 63.5% |
| Aleuts | 1.9 /100 | #239 | Tragic 63.4% |
| South Africans | 1.9 /100 | #240 | Tragic 63.4% |
| Immigrants | St. Vincent and the Grenadines | 1.9 /100 | #241 | Tragic 63.4% |
| Immigrants | Israel | 1.8 /100 | #242 | Tragic 63.4% |
| Immigrants | Czechoslovakia | 1.8 /100 | #243 | Tragic 63.4% |
| Eastern Europeans | 1.6 /100 | #244 | Tragic 63.4% |
Demographics Similar to Immigrants from Hong Kong by Family Households
In terms of family households, the demographic groups most similar to Immigrants from Hong Kong are Immigrants (66.1%, a difference of 0.010%), Pennsylvania German (66.1%, a difference of 0.020%), Immigrants from Asia (66.1%, a difference of 0.13%), Immigrants from Korea (66.0%, a difference of 0.15%), and South American (66.0%, a difference of 0.15%).
| Demographics | Rating | Rank | Family Households |
| Immigrants | South Central Asia | 100.0 /100 | #49 | Exceptional 66.4% |
| Navajo | 100.0 /100 | #50 | Exceptional 66.4% |
| Natives/Alaskans | 100.0 /100 | #51 | Exceptional 66.4% |
| Colombians | 100.0 /100 | #52 | Exceptional 66.3% |
| Afghans | 100.0 /100 | #53 | Exceptional 66.3% |
| Immigrants | Colombia | 100.0 /100 | #54 | Exceptional 66.3% |
| Immigrants | Immigrants | 100.0 /100 | #55 | Exceptional 66.1% |
| Immigrants | Hong Kong | 100.0 /100 | #56 | Exceptional 66.1% |
| Pennsylvania Germans | 100.0 /100 | #57 | Exceptional 66.1% |
| Immigrants | Asia | 100.0 /100 | #58 | Exceptional 66.1% |
| Immigrants | Korea | 100.0 /100 | #59 | Exceptional 66.0% |
| South Americans | 100.0 /100 | #60 | Exceptional 66.0% |
| Danes | 100.0 /100 | #61 | Exceptional 66.0% |
| Central Americans | 100.0 /100 | #62 | Exceptional 66.0% |
| Immigrants | Indonesia | 100.0 /100 | #63 | Exceptional 66.0% |