Estonian vs Immigrants from Dominica Family Households
COMPARE
Estonian
Immigrants from Dominica
Family Households
Family Households Comparison
Estonians
Immigrants from Dominica
62.9%
FAMILY HOUSEHOLDS
0.2/ 100
METRIC RATING
281st/ 347
METRIC RANK
63.4%
FAMILY HOUSEHOLDS
1.6/ 100
METRIC RATING
245th/ 347
METRIC RANK
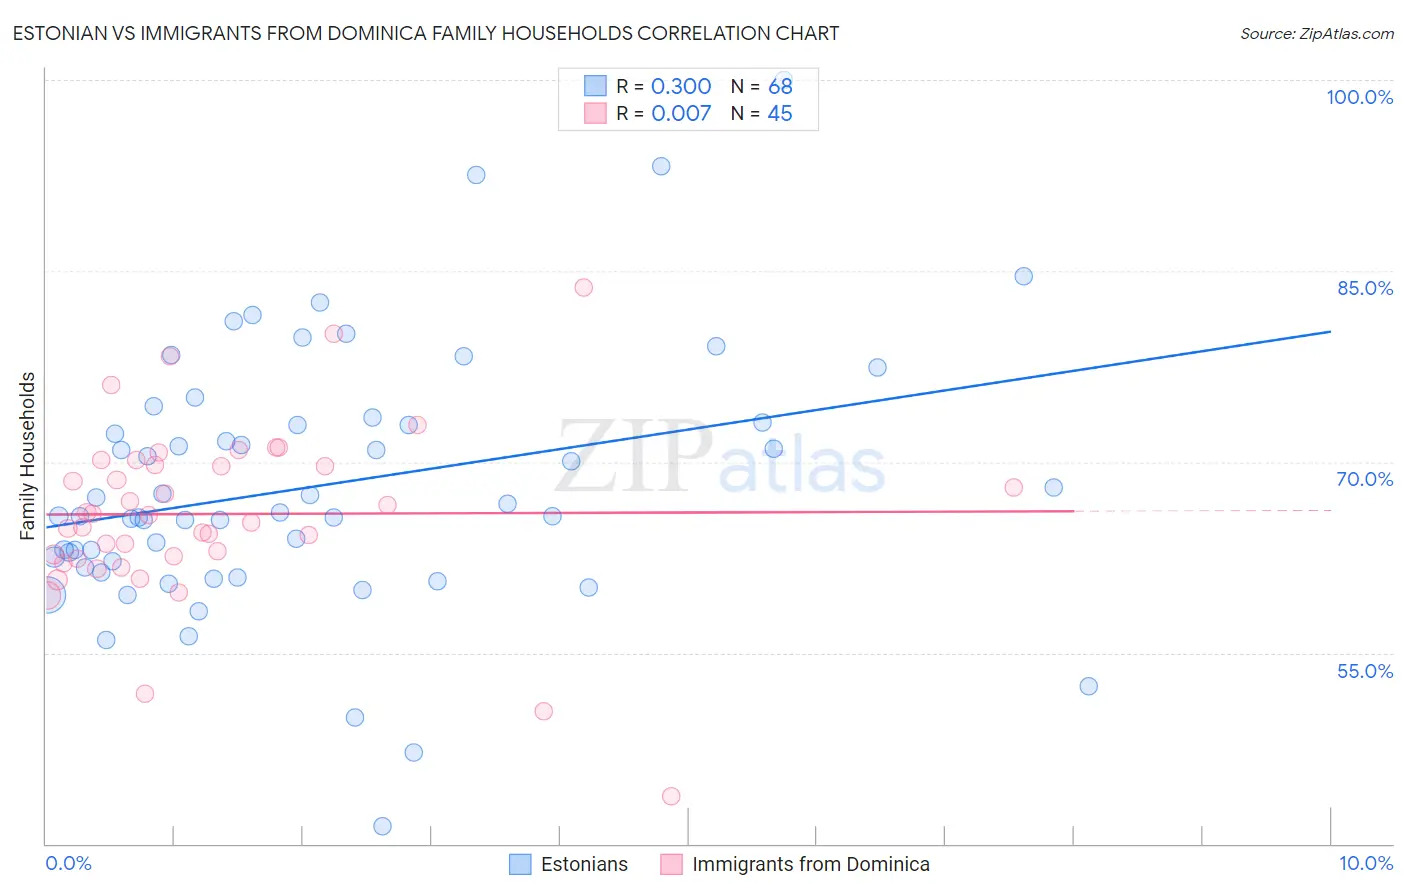
Estonian vs Immigrants from Dominica Family Households Correlation Chart
The statistical analysis conducted on geographies consisting of 123,500,742 people shows a weak positive correlation between the proportion of Estonians and percentage of family households in the United States with a correlation coefficient (R) of 0.300 and weighted average of 62.9%. Similarly, the statistical analysis conducted on geographies consisting of 83,778,248 people shows no correlation between the proportion of Immigrants from Dominica and percentage of family households in the United States with a correlation coefficient (R) of 0.007 and weighted average of 63.4%, a difference of 0.82%.
Family Households Correlation Summary
| Measurement | Estonian | Immigrants from Dominica |
| Minimum | 41.3% | 43.8% |
| Maximum | 100.0% | 83.7% |
| Range | 58.7% | 39.9% |
| Mean | 68.1% | 65.9% |
| Median | 65.9% | 65.8% |
| Interquartile 25% (IQ1) | 61.9% | 62.5% |
| Interquartile 75% (IQ3) | 73.0% | 69.9% |
| Interquartile Range (IQR) | 11.1% | 7.5% |
| Standard Deviation (Sample) | 10.2% | 7.1% |
| Standard Deviation (Population) | 10.2% | 7.0% |
Similar Demographics by Family Households
Demographics Similar to Estonians by Family Households
In terms of family households, the demographic groups most similar to Estonians are New Zealander (62.9%, a difference of 0.030%), Immigrants from Denmark (62.9%, a difference of 0.040%), Australian (62.8%, a difference of 0.080%), Immigrants from Bulgaria (63.0%, a difference of 0.090%), and Immigrants from Yemen (63.0%, a difference of 0.11%).
| Demographics | Rating | Rank | Family Households |
| Lumbee | 0.3 /100 | #274 | Tragic 63.1% |
| West Indians | 0.3 /100 | #275 | Tragic 63.1% |
| Serbians | 0.3 /100 | #276 | Tragic 63.0% |
| Ottawa | 0.3 /100 | #277 | Tragic 63.0% |
| Immigrants | Belgium | 0.2 /100 | #278 | Tragic 63.0% |
| Immigrants | Yemen | 0.2 /100 | #279 | Tragic 63.0% |
| Immigrants | Bulgaria | 0.2 /100 | #280 | Tragic 63.0% |
| Estonians | 0.2 /100 | #281 | Tragic 62.9% |
| New Zealanders | 0.1 /100 | #282 | Tragic 62.9% |
| Immigrants | Denmark | 0.1 /100 | #283 | Tragic 62.9% |
| Australians | 0.1 /100 | #284 | Tragic 62.8% |
| Mongolians | 0.1 /100 | #285 | Tragic 62.8% |
| British West Indians | 0.1 /100 | #286 | Tragic 62.8% |
| Latvians | 0.1 /100 | #287 | Tragic 62.8% |
| Immigrants | Uganda | 0.1 /100 | #288 | Tragic 62.7% |
Demographics Similar to Immigrants from Dominica by Family Households
In terms of family households, the demographic groups most similar to Immigrants from Dominica are Eastern European (63.4%, a difference of 0.0%), Immigrants from Ghana (63.4%, a difference of 0.020%), Immigrants from Czechoslovakia (63.4%, a difference of 0.030%), Immigrants from Uzbekistan (63.4%, a difference of 0.030%), and Immigrants from Israel (63.4%, a difference of 0.040%).
| Demographics | Rating | Rank | Family Households |
| Immigrants | Zimbabwe | 2.0 /100 | #238 | Tragic 63.5% |
| Aleuts | 1.9 /100 | #239 | Tragic 63.4% |
| South Africans | 1.9 /100 | #240 | Tragic 63.4% |
| Immigrants | St. Vincent and the Grenadines | 1.9 /100 | #241 | Tragic 63.4% |
| Immigrants | Israel | 1.8 /100 | #242 | Tragic 63.4% |
| Immigrants | Czechoslovakia | 1.8 /100 | #243 | Tragic 63.4% |
| Eastern Europeans | 1.6 /100 | #244 | Tragic 63.4% |
| Immigrants | Dominica | 1.6 /100 | #245 | Tragic 63.4% |
| Immigrants | Ghana | 1.6 /100 | #246 | Tragic 63.4% |
| Immigrants | Uzbekistan | 1.5 /100 | #247 | Tragic 63.4% |
| Dominicans | 1.5 /100 | #248 | Tragic 63.4% |
| Russians | 1.4 /100 | #249 | Tragic 63.4% |
| Immigrants | Japan | 1.4 /100 | #250 | Tragic 63.4% |
| Taiwanese | 1.2 /100 | #251 | Tragic 63.3% |
| Bahamians | 1.1 /100 | #252 | Tragic 63.3% |