Estonian vs South American Indian Family Households
COMPARE
Estonian
South American Indian
Family Households
Family Households Comparison
Estonians
South American Indians
62.9%
FAMILY HOUSEHOLDS
0.2/ 100
METRIC RATING
281st/ 347
METRIC RANK
64.6%
FAMILY HOUSEHOLDS
81.9/ 100
METRIC RATING
144th/ 347
METRIC RANK
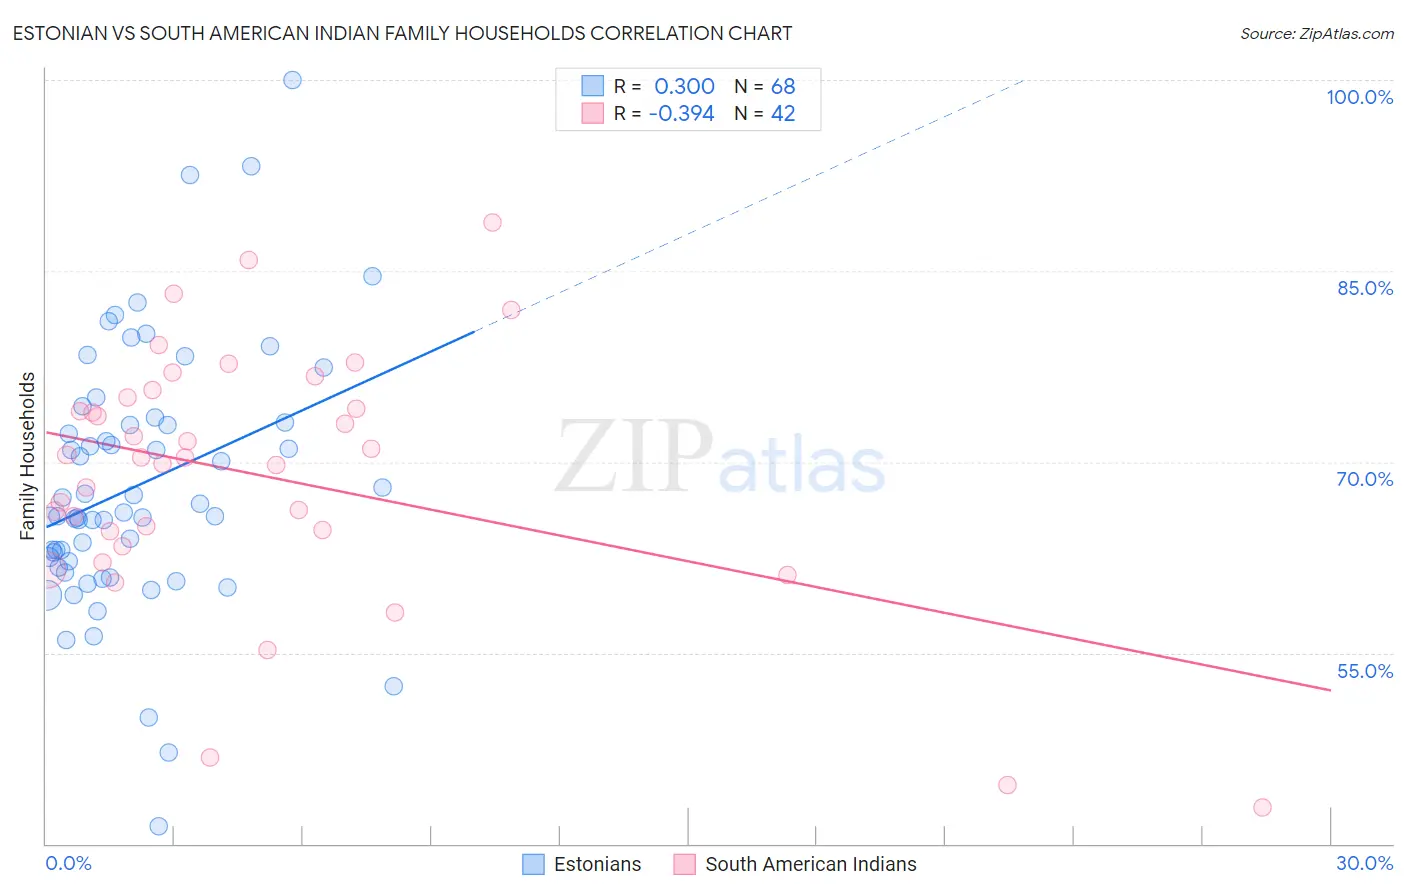
Estonian vs South American Indian Family Households Correlation Chart
The statistical analysis conducted on geographies consisting of 123,500,742 people shows a weak positive correlation between the proportion of Estonians and percentage of family households in the United States with a correlation coefficient (R) of 0.300 and weighted average of 62.9%. Similarly, the statistical analysis conducted on geographies consisting of 164,540,449 people shows a mild negative correlation between the proportion of South American Indians and percentage of family households in the United States with a correlation coefficient (R) of -0.394 and weighted average of 64.6%, a difference of 2.8%.
Family Households Correlation Summary
| Measurement | Estonian | South American Indian |
| Minimum | 41.3% | 42.9% |
| Maximum | 100.0% | 88.8% |
| Range | 58.7% | 45.9% |
| Mean | 68.1% | 69.0% |
| Median | 65.9% | 70.3% |
| Interquartile 25% (IQ1) | 61.9% | 64.6% |
| Interquartile 75% (IQ3) | 73.0% | 75.0% |
| Interquartile Range (IQR) | 11.1% | 10.5% |
| Standard Deviation (Sample) | 10.2% | 10.0% |
| Standard Deviation (Population) | 10.2% | 9.9% |
Similar Demographics by Family Households
Demographics Similar to Estonians by Family Households
In terms of family households, the demographic groups most similar to Estonians are New Zealander (62.9%, a difference of 0.030%), Immigrants from Denmark (62.9%, a difference of 0.040%), Australian (62.8%, a difference of 0.080%), Immigrants from Bulgaria (63.0%, a difference of 0.090%), and Immigrants from Yemen (63.0%, a difference of 0.11%).
| Demographics | Rating | Rank | Family Households |
| Lumbee | 0.3 /100 | #274 | Tragic 63.1% |
| West Indians | 0.3 /100 | #275 | Tragic 63.1% |
| Serbians | 0.3 /100 | #276 | Tragic 63.0% |
| Ottawa | 0.3 /100 | #277 | Tragic 63.0% |
| Immigrants | Belgium | 0.2 /100 | #278 | Tragic 63.0% |
| Immigrants | Yemen | 0.2 /100 | #279 | Tragic 63.0% |
| Immigrants | Bulgaria | 0.2 /100 | #280 | Tragic 63.0% |
| Estonians | 0.2 /100 | #281 | Tragic 62.9% |
| New Zealanders | 0.1 /100 | #282 | Tragic 62.9% |
| Immigrants | Denmark | 0.1 /100 | #283 | Tragic 62.9% |
| Australians | 0.1 /100 | #284 | Tragic 62.8% |
| Mongolians | 0.1 /100 | #285 | Tragic 62.8% |
| British West Indians | 0.1 /100 | #286 | Tragic 62.8% |
| Latvians | 0.1 /100 | #287 | Tragic 62.8% |
| Immigrants | Uganda | 0.1 /100 | #288 | Tragic 62.7% |
Demographics Similar to South American Indians by Family Households
In terms of family households, the demographic groups most similar to South American Indians are Czechoslovakian (64.6%, a difference of 0.0%), Welsh (64.6%, a difference of 0.040%), Pakistani (64.7%, a difference of 0.050%), Immigrants from North Macedonia (64.7%, a difference of 0.070%), and Immigrants from Cameroon (64.7%, a difference of 0.070%).
| Demographics | Rating | Rank | Family Households |
| Immigrants | Scotland | 86.4 /100 | #137 | Excellent 64.7% |
| Basques | 85.5 /100 | #138 | Excellent 64.7% |
| Immigrants | Jamaica | 85.3 /100 | #139 | Excellent 64.7% |
| Immigrants | North Macedonia | 84.9 /100 | #140 | Excellent 64.7% |
| Immigrants | Cameroon | 84.8 /100 | #141 | Excellent 64.7% |
| Pakistanis | 84.0 /100 | #142 | Excellent 64.7% |
| Czechoslovakians | 82.1 /100 | #143 | Excellent 64.6% |
| South American Indians | 81.9 /100 | #144 | Excellent 64.6% |
| Welsh | 80.1 /100 | #145 | Excellent 64.6% |
| Immigrants | Romania | 77.0 /100 | #146 | Good 64.6% |
| Immigrants | Chile | 76.5 /100 | #147 | Good 64.6% |
| Delaware | 76.3 /100 | #148 | Good 64.6% |
| Sioux | 76.3 /100 | #149 | Good 64.6% |
| Romanians | 75.3 /100 | #150 | Good 64.5% |
| Syrians | 75.2 /100 | #151 | Good 64.5% |