Bulgarian vs Immigrants from Hong Kong Family Households
COMPARE
Bulgarian
Immigrants from Hong Kong
Family Households
Family Households Comparison
Bulgarians
Immigrants from Hong Kong
63.6%
FAMILY HOUSEHOLDS
3.4/ 100
METRIC RATING
229th/ 347
METRIC RANK
66.1%
FAMILY HOUSEHOLDS
100.0/ 100
METRIC RATING
56th/ 347
METRIC RANK
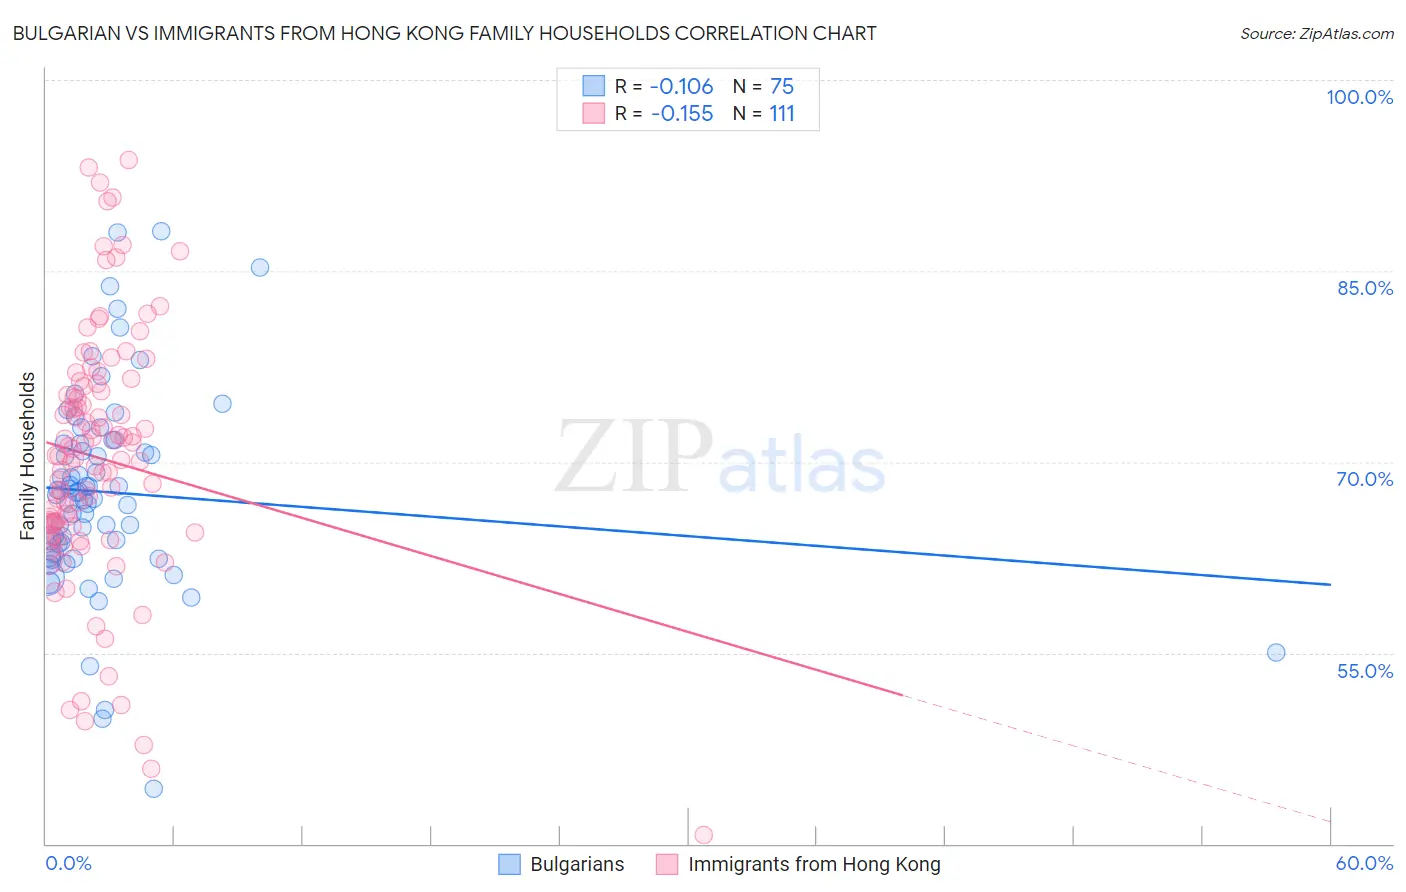
Bulgarian vs Immigrants from Hong Kong Family Households Correlation Chart
The statistical analysis conducted on geographies consisting of 205,566,238 people shows a poor negative correlation between the proportion of Bulgarians and percentage of family households in the United States with a correlation coefficient (R) of -0.106 and weighted average of 63.6%. Similarly, the statistical analysis conducted on geographies consisting of 253,896,995 people shows a poor negative correlation between the proportion of Immigrants from Hong Kong and percentage of family households in the United States with a correlation coefficient (R) of -0.155 and weighted average of 66.1%, a difference of 4.0%.
Family Households Correlation Summary
| Measurement | Bulgarian | Immigrants from Hong Kong |
| Minimum | 44.3% | 40.7% |
| Maximum | 88.1% | 93.8% |
| Range | 43.8% | 53.1% |
| Mean | 67.6% | 70.3% |
| Median | 67.4% | 70.5% |
| Interquartile 25% (IQ1) | 62.8% | 65.1% |
| Interquartile 75% (IQ3) | 71.5% | 75.9% |
| Interquartile Range (IQR) | 8.7% | 10.8% |
| Standard Deviation (Sample) | 8.0% | 9.9% |
| Standard Deviation (Population) | 7.9% | 9.9% |
Similar Demographics by Family Households
Demographics Similar to Bulgarians by Family Households
In terms of family households, the demographic groups most similar to Bulgarians are Blackfeet (63.6%, a difference of 0.020%), Immigrants from Brazil (63.6%, a difference of 0.040%), Immigrants from Greece (63.5%, a difference of 0.060%), Immigrants from Bahamas (63.6%, a difference of 0.070%), and Trinidadian and Tobagonian (63.6%, a difference of 0.070%).
| Demographics | Rating | Rank | Family Households |
| Immigrants | Belarus | 5.5 /100 | #222 | Tragic 63.7% |
| French Canadians | 5.4 /100 | #223 | Tragic 63.7% |
| Turks | 4.5 /100 | #224 | Tragic 63.6% |
| Immigrants | Hungary | 4.3 /100 | #225 | Tragic 63.6% |
| Immigrants | Bahamas | 4.2 /100 | #226 | Tragic 63.6% |
| Trinidadians and Tobagonians | 4.1 /100 | #227 | Tragic 63.6% |
| Blackfeet | 3.6 /100 | #228 | Tragic 63.6% |
| Bulgarians | 3.4 /100 | #229 | Tragic 63.6% |
| Immigrants | Brazil | 3.0 /100 | #230 | Tragic 63.6% |
| Immigrants | Greece | 2.9 /100 | #231 | Tragic 63.5% |
| Immigrants | Northern Africa | 2.6 /100 | #232 | Tragic 63.5% |
| Immigrants | Armenia | 2.6 /100 | #233 | Tragic 63.5% |
| Finns | 2.3 /100 | #234 | Tragic 63.5% |
| Albanians | 2.2 /100 | #235 | Tragic 63.5% |
| Ghanaians | 2.1 /100 | #236 | Tragic 63.5% |
Demographics Similar to Immigrants from Hong Kong by Family Households
In terms of family households, the demographic groups most similar to Immigrants from Hong Kong are Immigrants (66.1%, a difference of 0.010%), Pennsylvania German (66.1%, a difference of 0.020%), Immigrants from Asia (66.1%, a difference of 0.13%), Immigrants from Korea (66.0%, a difference of 0.15%), and South American (66.0%, a difference of 0.15%).
| Demographics | Rating | Rank | Family Households |
| Immigrants | South Central Asia | 100.0 /100 | #49 | Exceptional 66.4% |
| Navajo | 100.0 /100 | #50 | Exceptional 66.4% |
| Natives/Alaskans | 100.0 /100 | #51 | Exceptional 66.4% |
| Colombians | 100.0 /100 | #52 | Exceptional 66.3% |
| Afghans | 100.0 /100 | #53 | Exceptional 66.3% |
| Immigrants | Colombia | 100.0 /100 | #54 | Exceptional 66.3% |
| Immigrants | Immigrants | 100.0 /100 | #55 | Exceptional 66.1% |
| Immigrants | Hong Kong | 100.0 /100 | #56 | Exceptional 66.1% |
| Pennsylvania Germans | 100.0 /100 | #57 | Exceptional 66.1% |
| Immigrants | Asia | 100.0 /100 | #58 | Exceptional 66.1% |
| Immigrants | Korea | 100.0 /100 | #59 | Exceptional 66.0% |
| South Americans | 100.0 /100 | #60 | Exceptional 66.0% |
| Danes | 100.0 /100 | #61 | Exceptional 66.0% |
| Central Americans | 100.0 /100 | #62 | Exceptional 66.0% |
| Immigrants | Indonesia | 100.0 /100 | #63 | Exceptional 66.0% |