Estonian vs Immigrants from Hungary Family Households
COMPARE
Estonian
Immigrants from Hungary
Family Households
Family Households Comparison
Estonians
Immigrants from Hungary
62.9%
FAMILY HOUSEHOLDS
0.2/ 100
METRIC RATING
281st/ 347
METRIC RANK
63.6%
FAMILY HOUSEHOLDS
4.3/ 100
METRIC RATING
225th/ 347
METRIC RANK
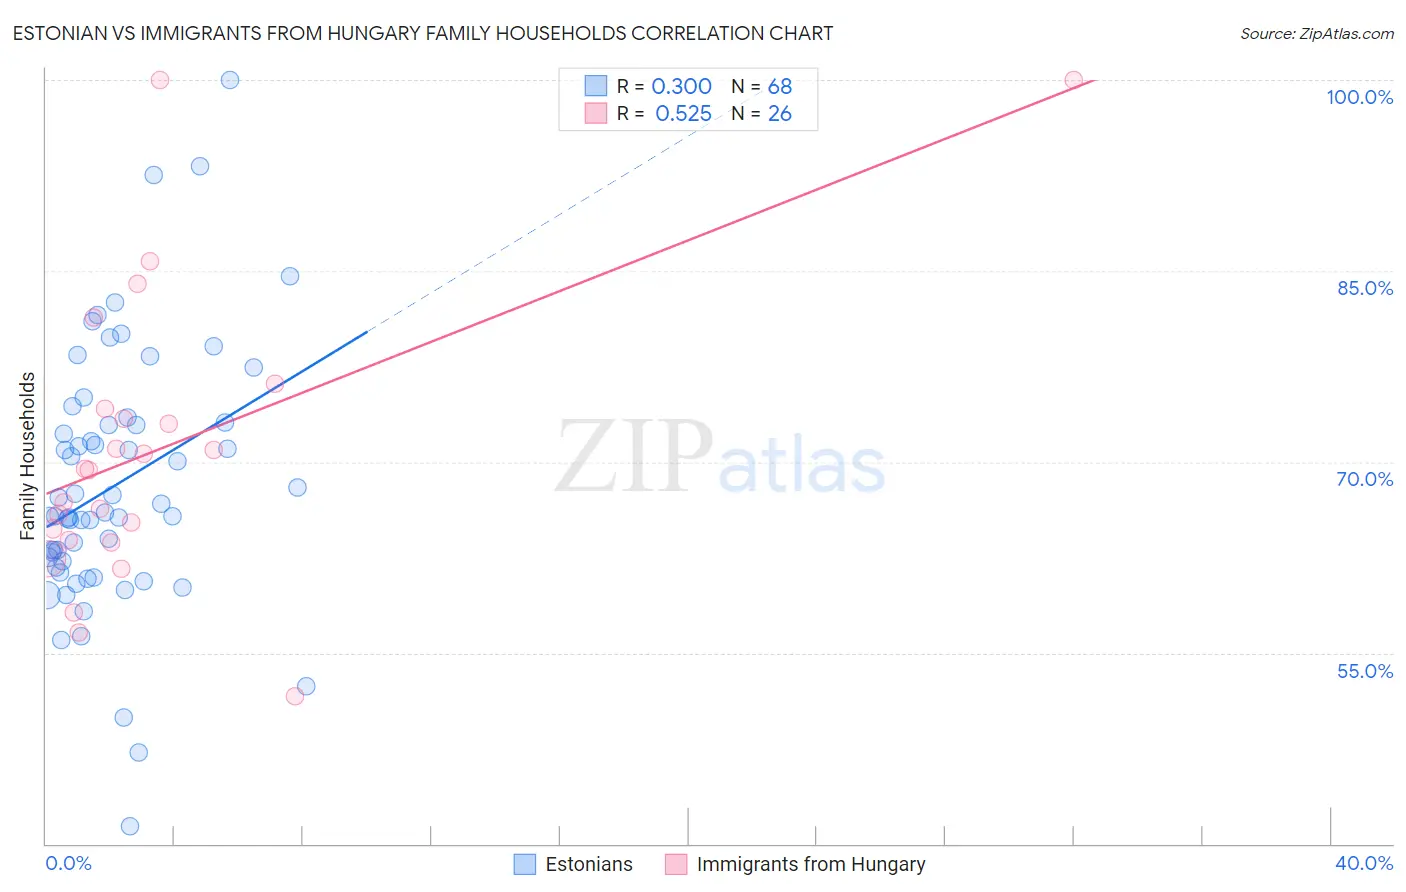
Estonian vs Immigrants from Hungary Family Households Correlation Chart
The statistical analysis conducted on geographies consisting of 123,500,742 people shows a weak positive correlation between the proportion of Estonians and percentage of family households in the United States with a correlation coefficient (R) of 0.300 and weighted average of 62.9%. Similarly, the statistical analysis conducted on geographies consisting of 195,664,672 people shows a substantial positive correlation between the proportion of Immigrants from Hungary and percentage of family households in the United States with a correlation coefficient (R) of 0.525 and weighted average of 63.6%, a difference of 1.2%.
Family Households Correlation Summary
| Measurement | Estonian | Immigrants from Hungary |
| Minimum | 41.3% | 51.6% |
| Maximum | 100.0% | 100.0% |
| Range | 58.7% | 48.4% |
| Mean | 68.1% | 71.0% |
| Median | 65.9% | 69.4% |
| Interquartile 25% (IQ1) | 61.9% | 63.9% |
| Interquartile 75% (IQ3) | 73.0% | 74.2% |
| Interquartile Range (IQR) | 11.1% | 10.3% |
| Standard Deviation (Sample) | 10.2% | 11.6% |
| Standard Deviation (Population) | 10.2% | 11.4% |
Similar Demographics by Family Households
Demographics Similar to Estonians by Family Households
In terms of family households, the demographic groups most similar to Estonians are New Zealander (62.9%, a difference of 0.030%), Immigrants from Denmark (62.9%, a difference of 0.040%), Australian (62.8%, a difference of 0.080%), Immigrants from Bulgaria (63.0%, a difference of 0.090%), and Immigrants from Yemen (63.0%, a difference of 0.11%).
| Demographics | Rating | Rank | Family Households |
| Lumbee | 0.3 /100 | #274 | Tragic 63.1% |
| West Indians | 0.3 /100 | #275 | Tragic 63.1% |
| Serbians | 0.3 /100 | #276 | Tragic 63.0% |
| Ottawa | 0.3 /100 | #277 | Tragic 63.0% |
| Immigrants | Belgium | 0.2 /100 | #278 | Tragic 63.0% |
| Immigrants | Yemen | 0.2 /100 | #279 | Tragic 63.0% |
| Immigrants | Bulgaria | 0.2 /100 | #280 | Tragic 63.0% |
| Estonians | 0.2 /100 | #281 | Tragic 62.9% |
| New Zealanders | 0.1 /100 | #282 | Tragic 62.9% |
| Immigrants | Denmark | 0.1 /100 | #283 | Tragic 62.9% |
| Australians | 0.1 /100 | #284 | Tragic 62.8% |
| Mongolians | 0.1 /100 | #285 | Tragic 62.8% |
| British West Indians | 0.1 /100 | #286 | Tragic 62.8% |
| Latvians | 0.1 /100 | #287 | Tragic 62.8% |
| Immigrants | Uganda | 0.1 /100 | #288 | Tragic 62.7% |
Demographics Similar to Immigrants from Hungary by Family Households
In terms of family households, the demographic groups most similar to Immigrants from Hungary are Turkish (63.6%, a difference of 0.010%), Immigrants from Bahamas (63.6%, a difference of 0.010%), Trinidadian and Tobagonian (63.6%, a difference of 0.020%), Blackfeet (63.6%, a difference of 0.070%), and French Canadian (63.7%, a difference of 0.080%).
| Demographics | Rating | Rank | Family Households |
| Marshallese | 6.9 /100 | #218 | Tragic 63.7% |
| Macedonians | 6.5 /100 | #219 | Tragic 63.7% |
| Immigrants | Europe | 6.4 /100 | #220 | Tragic 63.7% |
| Immigrants | South Africa | 5.9 /100 | #221 | Tragic 63.7% |
| Immigrants | Belarus | 5.5 /100 | #222 | Tragic 63.7% |
| French Canadians | 5.4 /100 | #223 | Tragic 63.7% |
| Turks | 4.5 /100 | #224 | Tragic 63.6% |
| Immigrants | Hungary | 4.3 /100 | #225 | Tragic 63.6% |
| Immigrants | Bahamas | 4.2 /100 | #226 | Tragic 63.6% |
| Trinidadians and Tobagonians | 4.1 /100 | #227 | Tragic 63.6% |
| Blackfeet | 3.6 /100 | #228 | Tragic 63.6% |
| Bulgarians | 3.4 /100 | #229 | Tragic 63.6% |
| Immigrants | Brazil | 3.0 /100 | #230 | Tragic 63.6% |
| Immigrants | Greece | 2.9 /100 | #231 | Tragic 63.5% |
| Immigrants | Northern Africa | 2.6 /100 | #232 | Tragic 63.5% |