Paiute vs Immigrants from Latvia Family Households
COMPARE
Paiute
Immigrants from Latvia
Family Households
Family Households Comparison
Paiute
Immigrants from Latvia
64.0%
FAMILY HOUSEHOLDS
22.2/ 100
METRIC RATING
194th/ 347
METRIC RANK
62.0%
FAMILY HOUSEHOLDS
0.0/ 100
METRIC RATING
312th/ 347
METRIC RANK
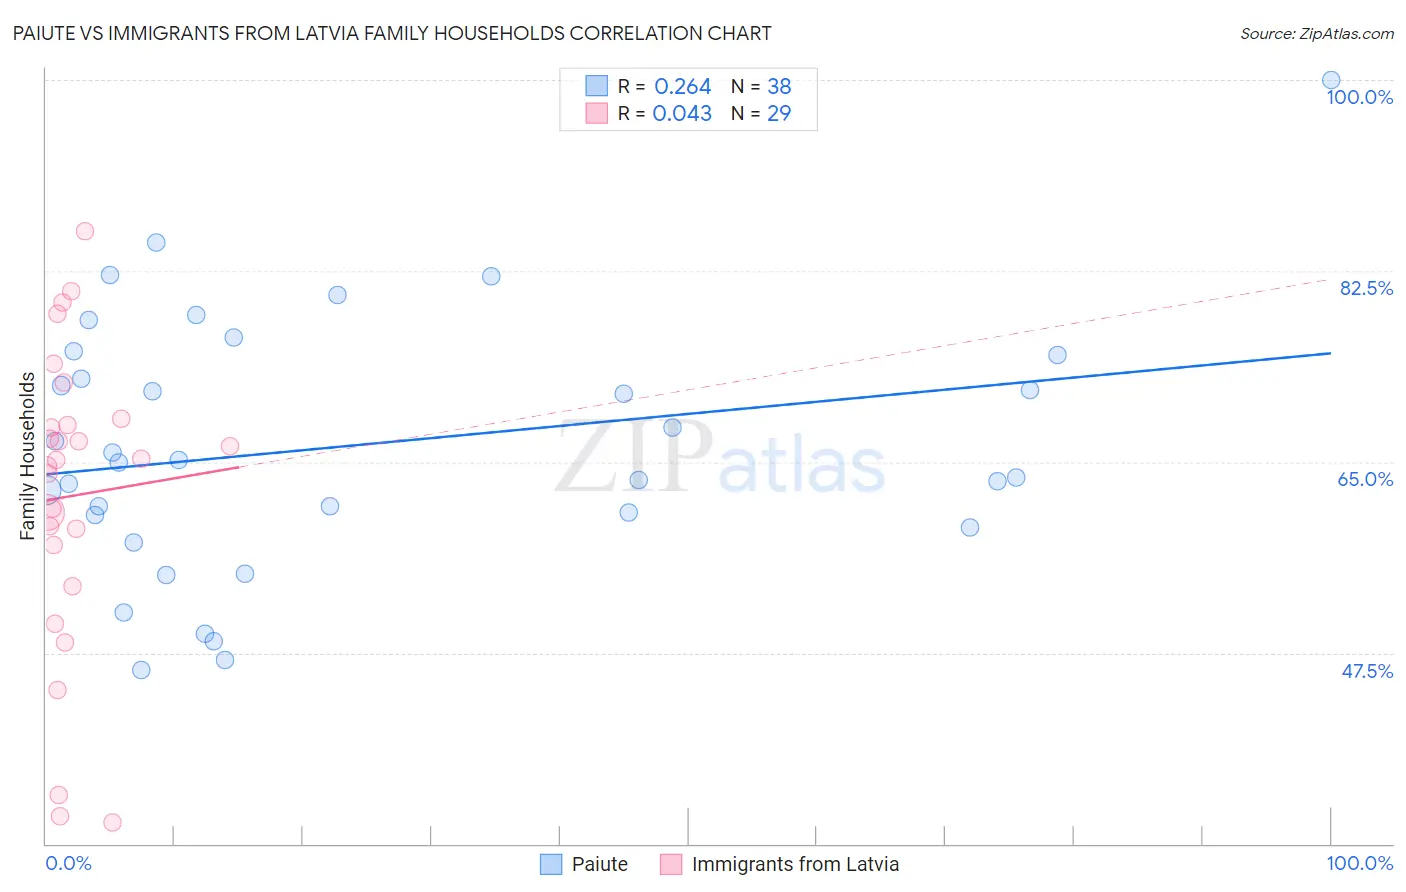
Paiute vs Immigrants from Latvia Family Households Correlation Chart
The statistical analysis conducted on geographies consisting of 58,392,138 people shows a weak positive correlation between the proportion of Paiute and percentage of family households in the United States with a correlation coefficient (R) of 0.264 and weighted average of 64.0%. Similarly, the statistical analysis conducted on geographies consisting of 113,726,313 people shows no correlation between the proportion of Immigrants from Latvia and percentage of family households in the United States with a correlation coefficient (R) of 0.043 and weighted average of 62.0%, a difference of 3.3%.
Family Households Correlation Summary
| Measurement | Paiute | Immigrants from Latvia |
| Minimum | 46.0% | 31.9% |
| Maximum | 100.0% | 86.2% |
| Range | 54.0% | 54.2% |
| Mean | 66.5% | 61.9% |
| Median | 65.0% | 65.2% |
| Interquartile 25% (IQ1) | 60.2% | 55.5% |
| Interquartile 75% (IQ3) | 74.8% | 68.7% |
| Interquartile Range (IQR) | 14.6% | 13.2% |
| Standard Deviation (Sample) | 11.7% | 13.8% |
| Standard Deviation (Population) | 11.6% | 13.5% |
Similar Demographics by Family Households
Demographics Similar to Paiute by Family Households
In terms of family households, the demographic groups most similar to Paiute are Lithuanian (64.0%, a difference of 0.030%), French (64.0%, a difference of 0.030%), Arab (64.1%, a difference of 0.040%), Immigrants from North America (64.0%, a difference of 0.040%), and Zimbabwean (64.1%, a difference of 0.050%).
| Demographics | Rating | Rank | Family Households |
| Northern Europeans | 28.2 /100 | #187 | Fair 64.1% |
| Paraguayans | 26.7 /100 | #188 | Fair 64.1% |
| Immigrants | Western Asia | 25.3 /100 | #189 | Fair 64.1% |
| Zimbabweans | 24.7 /100 | #190 | Fair 64.1% |
| Arabs | 24.5 /100 | #191 | Fair 64.1% |
| Lithuanians | 23.8 /100 | #192 | Fair 64.0% |
| French | 23.7 /100 | #193 | Fair 64.0% |
| Paiute | 22.2 /100 | #194 | Fair 64.0% |
| Immigrants | North America | 20.0 /100 | #195 | Poor 64.0% |
| Immigrants | Canada | 19.2 /100 | #196 | Poor 64.0% |
| Seminole | 18.9 /100 | #197 | Poor 64.0% |
| Poles | 18.9 /100 | #198 | Poor 64.0% |
| Slavs | 18.6 /100 | #199 | Poor 64.0% |
| Immigrants | Malaysia | 17.9 /100 | #200 | Poor 64.0% |
| Immigrants | Eastern Europe | 17.2 /100 | #201 | Poor 64.0% |
Demographics Similar to Immigrants from Latvia by Family Households
In terms of family households, the demographic groups most similar to Immigrants from Latvia are Liberian (62.0%, a difference of 0.010%), Immigrants from Morocco (62.0%, a difference of 0.050%), Immigrants from Cabo Verde (61.9%, a difference of 0.060%), Immigrants from Liberia (62.0%, a difference of 0.080%), and Moroccan (61.9%, a difference of 0.10%).
| Demographics | Rating | Rank | Family Households |
| Bermudans | 0.0 /100 | #305 | Tragic 62.2% |
| Africans | 0.0 /100 | #306 | Tragic 62.1% |
| Immigrants | Norway | 0.0 /100 | #307 | Tragic 62.1% |
| Chippewa | 0.0 /100 | #308 | Tragic 62.1% |
| Sub-Saharan Africans | 0.0 /100 | #309 | Tragic 62.1% |
| Immigrants | Liberia | 0.0 /100 | #310 | Tragic 62.0% |
| Immigrants | Morocco | 0.0 /100 | #311 | Tragic 62.0% |
| Immigrants | Latvia | 0.0 /100 | #312 | Tragic 62.0% |
| Liberians | 0.0 /100 | #313 | Tragic 62.0% |
| Immigrants | Cabo Verde | 0.0 /100 | #314 | Tragic 61.9% |
| Moroccans | 0.0 /100 | #315 | Tragic 61.9% |
| Immigrants | Middle Africa | 0.0 /100 | #316 | Tragic 61.9% |
| Immigrants | Bosnia and Herzegovina | 0.0 /100 | #317 | Tragic 61.9% |
| Alaskan Athabascans | 0.0 /100 | #318 | Tragic 61.8% |
| Cape Verdeans | 0.0 /100 | #319 | Tragic 61.8% |