English vs Zimbabwean Family Households
COMPARE
English
Zimbabwean
Family Households
Family Households Comparison
English
Zimbabweans
65.1%
FAMILY HOUSEHOLDS
97.4/ 100
METRIC RATING
105th/ 347
METRIC RANK
64.1%
FAMILY HOUSEHOLDS
24.7/ 100
METRIC RATING
190th/ 347
METRIC RANK
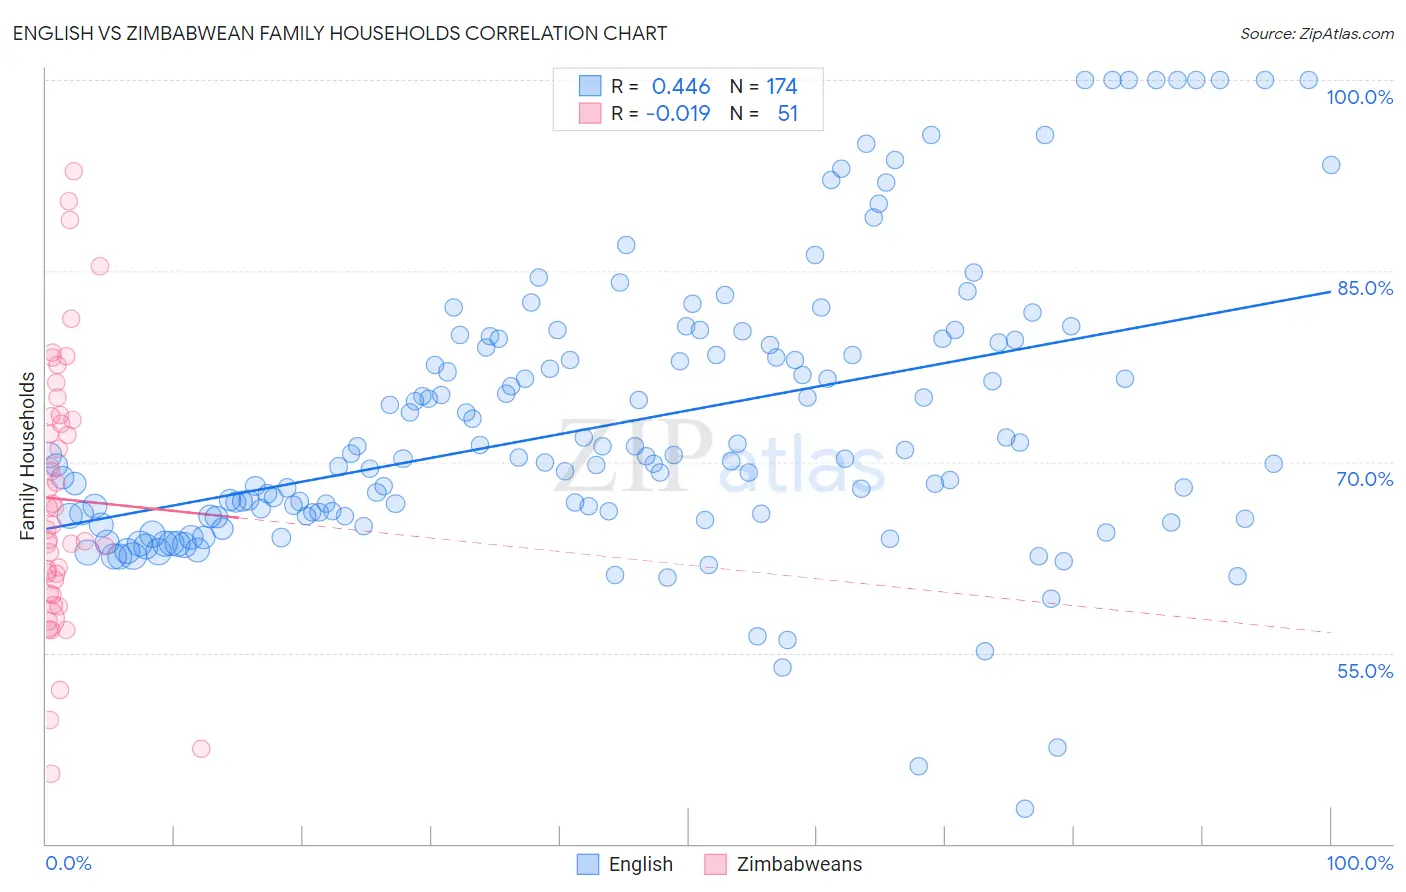
English vs Zimbabwean Family Households Correlation Chart
The statistical analysis conducted on geographies consisting of 579,316,298 people shows a moderate positive correlation between the proportion of English and percentage of family households in the United States with a correlation coefficient (R) of 0.446 and weighted average of 65.1%. Similarly, the statistical analysis conducted on geographies consisting of 69,192,017 people shows no correlation between the proportion of Zimbabweans and percentage of family households in the United States with a correlation coefficient (R) of -0.019 and weighted average of 64.1%, a difference of 1.6%.
Family Households Correlation Summary
| Measurement | English | Zimbabwean |
| Minimum | 42.7% | 45.5% |
| Maximum | 100.0% | 92.9% |
| Range | 57.3% | 47.3% |
| Mean | 73.0% | 67.1% |
| Median | 70.3% | 65.0% |
| Interquartile 25% (IQ1) | 65.8% | 59.7% |
| Interquartile 75% (IQ3) | 79.2% | 73.6% |
| Interquartile Range (IQR) | 13.5% | 13.9% |
| Standard Deviation (Sample) | 11.1% | 10.5% |
| Standard Deviation (Population) | 11.0% | 10.4% |
Similar Demographics by Family Households
Demographics Similar to English by Family Households
In terms of family households, the demographic groups most similar to English are White/Caucasian (65.1%, a difference of 0.010%), Alaska Native (65.1%, a difference of 0.010%), Palestinian (65.1%, a difference of 0.020%), Immigrants from Guatemala (65.0%, a difference of 0.060%), and Indian (Asian) (65.1%, a difference of 0.070%).
| Demographics | Rating | Rank | Family Households |
| Immigrants | Syria | 98.4 /100 | #98 | Exceptional 65.2% |
| Central American Indians | 98.3 /100 | #99 | Exceptional 65.2% |
| Haitians | 98.1 /100 | #100 | Exceptional 65.2% |
| Chileans | 98.1 /100 | #101 | Exceptional 65.2% |
| Immigrants | Sri Lanka | 98.0 /100 | #102 | Exceptional 65.1% |
| Indians (Asian) | 97.9 /100 | #103 | Exceptional 65.1% |
| Spaniards | 97.8 /100 | #104 | Exceptional 65.1% |
| English | 97.4 /100 | #105 | Exceptional 65.1% |
| Whites/Caucasians | 97.3 /100 | #106 | Exceptional 65.1% |
| Alaska Natives | 97.3 /100 | #107 | Exceptional 65.1% |
| Palestinians | 97.2 /100 | #108 | Exceptional 65.1% |
| Immigrants | Guatemala | 96.9 /100 | #109 | Exceptional 65.0% |
| Scandinavians | 96.8 /100 | #110 | Exceptional 65.0% |
| Europeans | 96.8 /100 | #111 | Exceptional 65.0% |
| Immigrants | Jordan | 96.5 /100 | #112 | Exceptional 65.0% |
Demographics Similar to Zimbabweans by Family Households
In terms of family households, the demographic groups most similar to Zimbabweans are Arab (64.1%, a difference of 0.0%), Immigrants from Western Asia (64.1%, a difference of 0.010%), Lithuanian (64.0%, a difference of 0.020%), French (64.0%, a difference of 0.020%), and Paraguayan (64.1%, a difference of 0.040%).
| Demographics | Rating | Rank | Family Households |
| Creek | 34.1 /100 | #183 | Fair 64.2% |
| Puerto Ricans | 33.4 /100 | #184 | Fair 64.2% |
| Immigrants | Iran | 30.4 /100 | #185 | Fair 64.1% |
| Spanish Americans | 30.1 /100 | #186 | Fair 64.1% |
| Northern Europeans | 28.2 /100 | #187 | Fair 64.1% |
| Paraguayans | 26.7 /100 | #188 | Fair 64.1% |
| Immigrants | Western Asia | 25.3 /100 | #189 | Fair 64.1% |
| Zimbabweans | 24.7 /100 | #190 | Fair 64.1% |
| Arabs | 24.5 /100 | #191 | Fair 64.1% |
| Lithuanians | 23.8 /100 | #192 | Fair 64.0% |
| French | 23.7 /100 | #193 | Fair 64.0% |
| Paiute | 22.2 /100 | #194 | Fair 64.0% |
| Immigrants | North America | 20.0 /100 | #195 | Poor 64.0% |
| Immigrants | Canada | 19.2 /100 | #196 | Poor 64.0% |
| Seminole | 18.9 /100 | #197 | Poor 64.0% |