Armenian vs Immigrants from Latvia Family Households
COMPARE
Armenian
Immigrants from Latvia
Family Households
Family Households Comparison
Armenians
Immigrants from Latvia
64.4%
FAMILY HOUSEHOLDS
55.9/ 100
METRIC RATING
170th/ 347
METRIC RANK
62.0%
FAMILY HOUSEHOLDS
0.0/ 100
METRIC RATING
312th/ 347
METRIC RANK
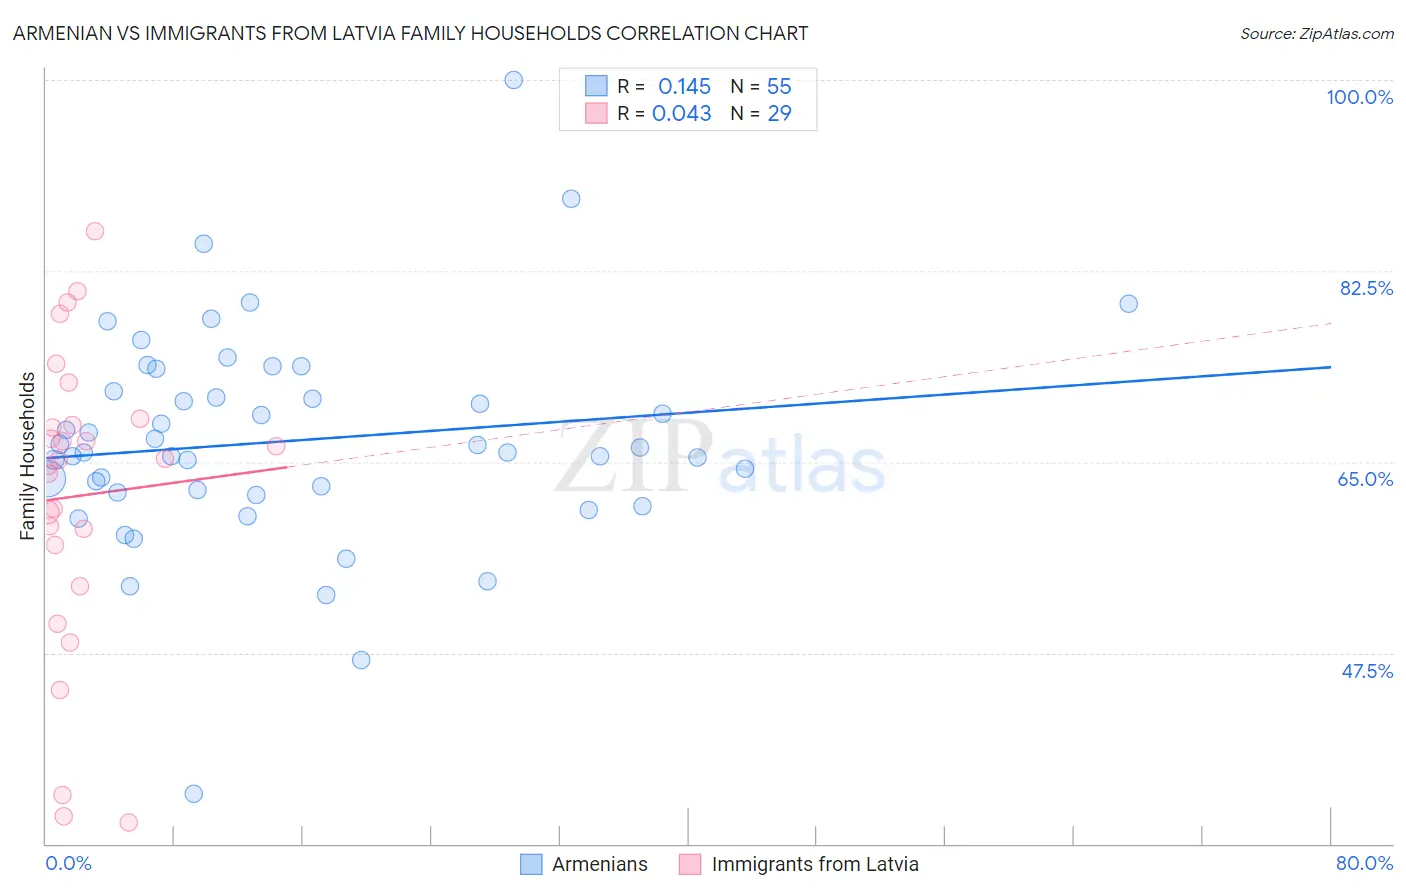
Armenian vs Immigrants from Latvia Family Households Correlation Chart
The statistical analysis conducted on geographies consisting of 310,784,197 people shows a poor positive correlation between the proportion of Armenians and percentage of family households in the United States with a correlation coefficient (R) of 0.145 and weighted average of 64.4%. Similarly, the statistical analysis conducted on geographies consisting of 113,726,313 people shows no correlation between the proportion of Immigrants from Latvia and percentage of family households in the United States with a correlation coefficient (R) of 0.043 and weighted average of 62.0%, a difference of 3.8%.
Family Households Correlation Summary
| Measurement | Armenian | Immigrants from Latvia |
| Minimum | 34.5% | 31.9% |
| Maximum | 100.0% | 86.2% |
| Range | 65.5% | 54.2% |
| Mean | 66.9% | 61.9% |
| Median | 65.9% | 65.2% |
| Interquartile 25% (IQ1) | 62.2% | 55.5% |
| Interquartile 75% (IQ3) | 71.4% | 68.7% |
| Interquartile Range (IQR) | 9.3% | 13.2% |
| Standard Deviation (Sample) | 10.1% | 13.8% |
| Standard Deviation (Population) | 10.0% | 13.5% |
Similar Demographics by Family Households
Demographics Similar to Armenians by Family Households
In terms of family households, the demographic groups most similar to Armenians are Iraqi (64.4%, a difference of 0.0%), Honduran (64.4%, a difference of 0.020%), Ute (64.3%, a difference of 0.020%), Irish (64.4%, a difference of 0.030%), and Dutch West Indian (64.3%, a difference of 0.030%).
| Demographics | Rating | Rank | Family Households |
| Chickasaw | 61.5 /100 | #163 | Good 64.4% |
| Immigrants | Nigeria | 60.1 /100 | #164 | Good 64.4% |
| Immigrants | Southern Europe | 60.0 /100 | #165 | Good 64.4% |
| Scotch-Irish | 59.2 /100 | #166 | Average 64.4% |
| Irish | 57.9 /100 | #167 | Average 64.4% |
| Hondurans | 57.5 /100 | #168 | Average 64.4% |
| Iraqis | 56.0 /100 | #169 | Average 64.4% |
| Armenians | 55.9 /100 | #170 | Average 64.4% |
| Ute | 54.6 /100 | #171 | Average 64.3% |
| Dutch West Indians | 53.9 /100 | #172 | Average 64.3% |
| Immigrants | Sierra Leone | 52.5 /100 | #173 | Average 64.3% |
| Immigrants | Germany | 50.0 /100 | #174 | Average 64.3% |
| Bangladeshis | 44.3 /100 | #175 | Average 64.3% |
| Vietnamese | 43.6 /100 | #176 | Average 64.2% |
| Immigrants | Micronesia | 42.3 /100 | #177 | Average 64.2% |
Demographics Similar to Immigrants from Latvia by Family Households
In terms of family households, the demographic groups most similar to Immigrants from Latvia are Liberian (62.0%, a difference of 0.010%), Immigrants from Morocco (62.0%, a difference of 0.050%), Immigrants from Cabo Verde (61.9%, a difference of 0.060%), Immigrants from Liberia (62.0%, a difference of 0.080%), and Moroccan (61.9%, a difference of 0.10%).
| Demographics | Rating | Rank | Family Households |
| Bermudans | 0.0 /100 | #305 | Tragic 62.2% |
| Africans | 0.0 /100 | #306 | Tragic 62.1% |
| Immigrants | Norway | 0.0 /100 | #307 | Tragic 62.1% |
| Chippewa | 0.0 /100 | #308 | Tragic 62.1% |
| Sub-Saharan Africans | 0.0 /100 | #309 | Tragic 62.1% |
| Immigrants | Liberia | 0.0 /100 | #310 | Tragic 62.0% |
| Immigrants | Morocco | 0.0 /100 | #311 | Tragic 62.0% |
| Immigrants | Latvia | 0.0 /100 | #312 | Tragic 62.0% |
| Liberians | 0.0 /100 | #313 | Tragic 62.0% |
| Immigrants | Cabo Verde | 0.0 /100 | #314 | Tragic 61.9% |
| Moroccans | 0.0 /100 | #315 | Tragic 61.9% |
| Immigrants | Middle Africa | 0.0 /100 | #316 | Tragic 61.9% |
| Immigrants | Bosnia and Herzegovina | 0.0 /100 | #317 | Tragic 61.9% |
| Alaskan Athabascans | 0.0 /100 | #318 | Tragic 61.8% |
| Cape Verdeans | 0.0 /100 | #319 | Tragic 61.8% |