English vs Honduran Family Households
COMPARE
English
Honduran
Family Households
Family Households Comparison
English
Hondurans
65.1%
FAMILY HOUSEHOLDS
97.4/ 100
METRIC RATING
105th/ 347
METRIC RANK
64.4%
FAMILY HOUSEHOLDS
57.5/ 100
METRIC RATING
168th/ 347
METRIC RANK
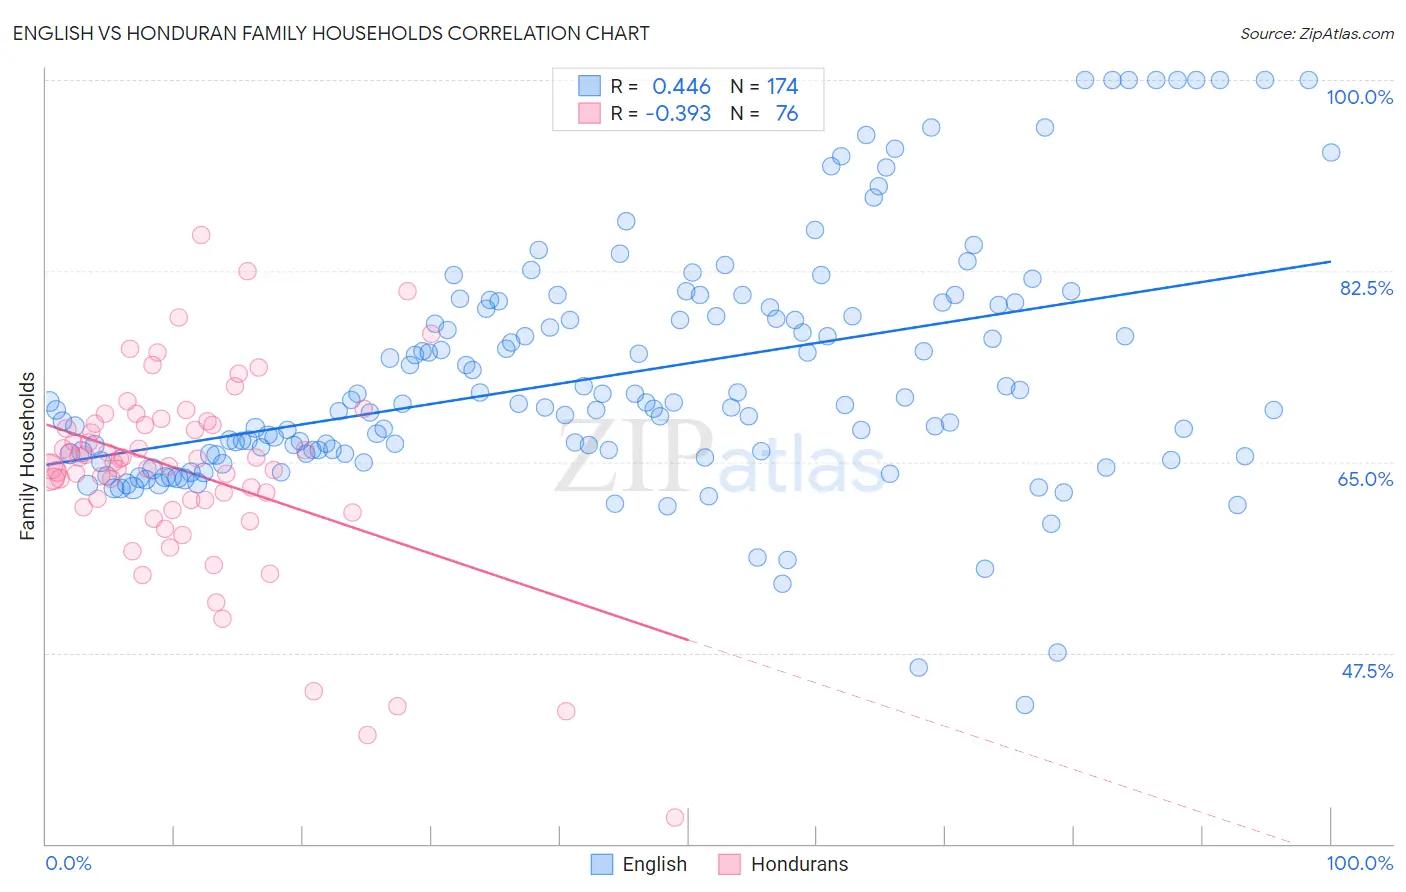
English vs Honduran Family Households Correlation Chart
The statistical analysis conducted on geographies consisting of 579,316,298 people shows a moderate positive correlation between the proportion of English and percentage of family households in the United States with a correlation coefficient (R) of 0.446 and weighted average of 65.1%. Similarly, the statistical analysis conducted on geographies consisting of 357,606,635 people shows a mild negative correlation between the proportion of Hondurans and percentage of family households in the United States with a correlation coefficient (R) of -0.393 and weighted average of 64.4%, a difference of 1.1%.
Family Households Correlation Summary
| Measurement | English | Honduran |
| Minimum | 42.7% | 32.4% |
| Maximum | 100.0% | 85.8% |
| Range | 57.3% | 53.5% |
| Mean | 73.0% | 64.1% |
| Median | 70.3% | 64.8% |
| Interquartile 25% (IQ1) | 65.8% | 61.2% |
| Interquartile 75% (IQ3) | 79.2% | 68.5% |
| Interquartile Range (IQR) | 13.5% | 7.3% |
| Standard Deviation (Sample) | 11.1% | 9.1% |
| Standard Deviation (Population) | 11.0% | 9.0% |
Similar Demographics by Family Households
Demographics Similar to English by Family Households
In terms of family households, the demographic groups most similar to English are White/Caucasian (65.1%, a difference of 0.010%), Alaska Native (65.1%, a difference of 0.010%), Palestinian (65.1%, a difference of 0.020%), Immigrants from Guatemala (65.0%, a difference of 0.060%), and Indian (Asian) (65.1%, a difference of 0.070%).
| Demographics | Rating | Rank | Family Households |
| Immigrants | Syria | 98.4 /100 | #98 | Exceptional 65.2% |
| Central American Indians | 98.3 /100 | #99 | Exceptional 65.2% |
| Haitians | 98.1 /100 | #100 | Exceptional 65.2% |
| Chileans | 98.1 /100 | #101 | Exceptional 65.2% |
| Immigrants | Sri Lanka | 98.0 /100 | #102 | Exceptional 65.1% |
| Indians (Asian) | 97.9 /100 | #103 | Exceptional 65.1% |
| Spaniards | 97.8 /100 | #104 | Exceptional 65.1% |
| English | 97.4 /100 | #105 | Exceptional 65.1% |
| Whites/Caucasians | 97.3 /100 | #106 | Exceptional 65.1% |
| Alaska Natives | 97.3 /100 | #107 | Exceptional 65.1% |
| Palestinians | 97.2 /100 | #108 | Exceptional 65.1% |
| Immigrants | Guatemala | 96.9 /100 | #109 | Exceptional 65.0% |
| Scandinavians | 96.8 /100 | #110 | Exceptional 65.0% |
| Europeans | 96.8 /100 | #111 | Exceptional 65.0% |
| Immigrants | Jordan | 96.5 /100 | #112 | Exceptional 65.0% |
Demographics Similar to Hondurans by Family Households
In terms of family households, the demographic groups most similar to Hondurans are Irish (64.4%, a difference of 0.010%), Scotch-Irish (64.4%, a difference of 0.020%), Iraqi (64.4%, a difference of 0.020%), Armenian (64.4%, a difference of 0.020%), and Immigrants from Nigeria (64.4%, a difference of 0.040%).
| Demographics | Rating | Rank | Family Households |
| Immigrants | England | 62.6 /100 | #161 | Good 64.4% |
| British | 61.6 /100 | #162 | Good 64.4% |
| Chickasaw | 61.5 /100 | #163 | Good 64.4% |
| Immigrants | Nigeria | 60.1 /100 | #164 | Good 64.4% |
| Immigrants | Southern Europe | 60.0 /100 | #165 | Good 64.4% |
| Scotch-Irish | 59.2 /100 | #166 | Average 64.4% |
| Irish | 57.9 /100 | #167 | Average 64.4% |
| Hondurans | 57.5 /100 | #168 | Average 64.4% |
| Iraqis | 56.0 /100 | #169 | Average 64.4% |
| Armenians | 55.9 /100 | #170 | Average 64.4% |
| Ute | 54.6 /100 | #171 | Average 64.3% |
| Dutch West Indians | 53.9 /100 | #172 | Average 64.3% |
| Immigrants | Sierra Leone | 52.5 /100 | #173 | Average 64.3% |
| Immigrants | Germany | 50.0 /100 | #174 | Average 64.3% |
| Bangladeshis | 44.3 /100 | #175 | Average 64.3% |