Navajo vs Immigrants from Latvia Family Households
COMPARE
Navajo
Immigrants from Latvia
Family Households
Family Households Comparison
Navajo
Immigrants from Latvia
66.4%
FAMILY HOUSEHOLDS
100.0/ 100
METRIC RATING
50th/ 347
METRIC RANK
62.0%
FAMILY HOUSEHOLDS
0.0/ 100
METRIC RATING
312th/ 347
METRIC RANK
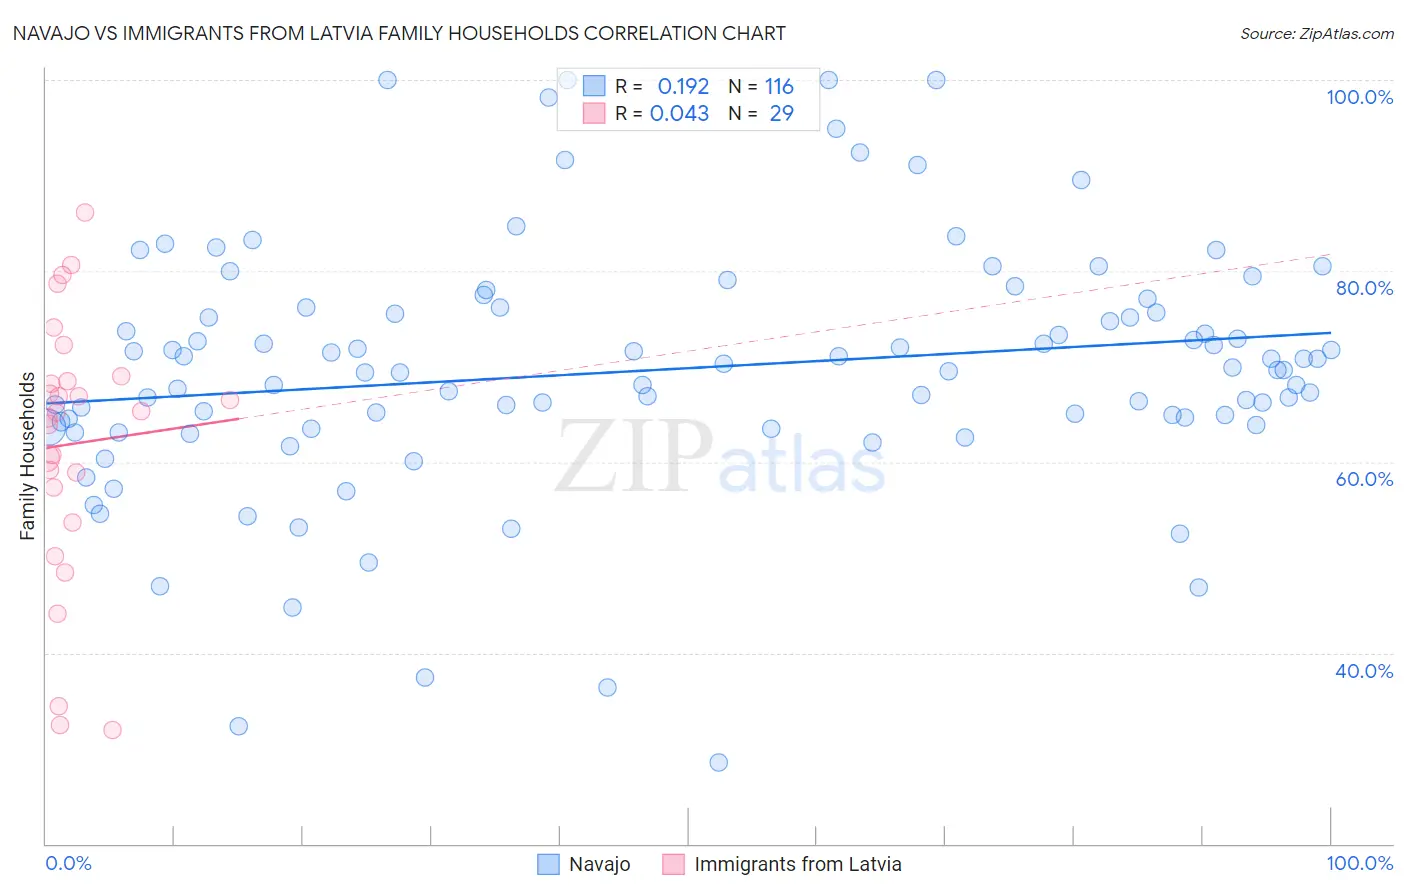
Navajo vs Immigrants from Latvia Family Households Correlation Chart
The statistical analysis conducted on geographies consisting of 224,752,458 people shows a poor positive correlation between the proportion of Navajo and percentage of family households in the United States with a correlation coefficient (R) of 0.192 and weighted average of 66.4%. Similarly, the statistical analysis conducted on geographies consisting of 113,726,313 people shows no correlation between the proportion of Immigrants from Latvia and percentage of family households in the United States with a correlation coefficient (R) of 0.043 and weighted average of 62.0%, a difference of 7.1%.
Family Households Correlation Summary
| Measurement | Navajo | Immigrants from Latvia |
| Minimum | 28.6% | 31.9% |
| Maximum | 100.0% | 86.2% |
| Range | 71.4% | 54.2% |
| Mean | 69.7% | 61.9% |
| Median | 69.7% | 65.2% |
| Interquartile 25% (IQ1) | 64.0% | 55.5% |
| Interquartile 75% (IQ3) | 75.9% | 68.7% |
| Interquartile Range (IQR) | 11.9% | 13.2% |
| Standard Deviation (Sample) | 13.1% | 13.8% |
| Standard Deviation (Population) | 13.0% | 13.5% |
Similar Demographics by Family Households
Demographics Similar to Navajo by Family Households
In terms of family households, the demographic groups most similar to Navajo are Native/Alaskan (66.4%, a difference of 0.030%), Immigrants from South Central Asia (66.4%, a difference of 0.070%), Immigrants from Venezuela (66.4%, a difference of 0.12%), Bolivian (66.5%, a difference of 0.14%), and Colombian (66.3%, a difference of 0.16%).
| Demographics | Rating | Rank | Family Households |
| Apache | 100.0 /100 | #43 | Exceptional 66.5% |
| Asians | 100.0 /100 | #44 | Exceptional 66.5% |
| Venezuelans | 100.0 /100 | #45 | Exceptional 66.5% |
| Arapaho | 100.0 /100 | #46 | Exceptional 66.5% |
| Bolivians | 100.0 /100 | #47 | Exceptional 66.5% |
| Immigrants | Venezuela | 100.0 /100 | #48 | Exceptional 66.4% |
| Immigrants | South Central Asia | 100.0 /100 | #49 | Exceptional 66.4% |
| Navajo | 100.0 /100 | #50 | Exceptional 66.4% |
| Natives/Alaskans | 100.0 /100 | #51 | Exceptional 66.4% |
| Colombians | 100.0 /100 | #52 | Exceptional 66.3% |
| Afghans | 100.0 /100 | #53 | Exceptional 66.3% |
| Immigrants | Colombia | 100.0 /100 | #54 | Exceptional 66.3% |
| Immigrants | Immigrants | 100.0 /100 | #55 | Exceptional 66.1% |
| Immigrants | Hong Kong | 100.0 /100 | #56 | Exceptional 66.1% |
| Pennsylvania Germans | 100.0 /100 | #57 | Exceptional 66.1% |
Demographics Similar to Immigrants from Latvia by Family Households
In terms of family households, the demographic groups most similar to Immigrants from Latvia are Liberian (62.0%, a difference of 0.010%), Immigrants from Morocco (62.0%, a difference of 0.050%), Immigrants from Cabo Verde (61.9%, a difference of 0.060%), Immigrants from Liberia (62.0%, a difference of 0.080%), and Moroccan (61.9%, a difference of 0.10%).
| Demographics | Rating | Rank | Family Households |
| Bermudans | 0.0 /100 | #305 | Tragic 62.2% |
| Africans | 0.0 /100 | #306 | Tragic 62.1% |
| Immigrants | Norway | 0.0 /100 | #307 | Tragic 62.1% |
| Chippewa | 0.0 /100 | #308 | Tragic 62.1% |
| Sub-Saharan Africans | 0.0 /100 | #309 | Tragic 62.1% |
| Immigrants | Liberia | 0.0 /100 | #310 | Tragic 62.0% |
| Immigrants | Morocco | 0.0 /100 | #311 | Tragic 62.0% |
| Immigrants | Latvia | 0.0 /100 | #312 | Tragic 62.0% |
| Liberians | 0.0 /100 | #313 | Tragic 62.0% |
| Immigrants | Cabo Verde | 0.0 /100 | #314 | Tragic 61.9% |
| Moroccans | 0.0 /100 | #315 | Tragic 61.9% |
| Immigrants | Middle Africa | 0.0 /100 | #316 | Tragic 61.9% |
| Immigrants | Bosnia and Herzegovina | 0.0 /100 | #317 | Tragic 61.9% |
| Alaskan Athabascans | 0.0 /100 | #318 | Tragic 61.8% |
| Cape Verdeans | 0.0 /100 | #319 | Tragic 61.8% |