Dutch vs Immigrants from Eritrea Family Households
COMPARE
Dutch
Immigrants from Eritrea
Family Households
Family Households Comparison
Dutch
Immigrants from Eritrea
64.9%
FAMILY HOUSEHOLDS
95.1/ 100
METRIC RATING
118th/ 347
METRIC RANK
60.8%
FAMILY HOUSEHOLDS
0.0/ 100
METRIC RATING
338th/ 347
METRIC RANK
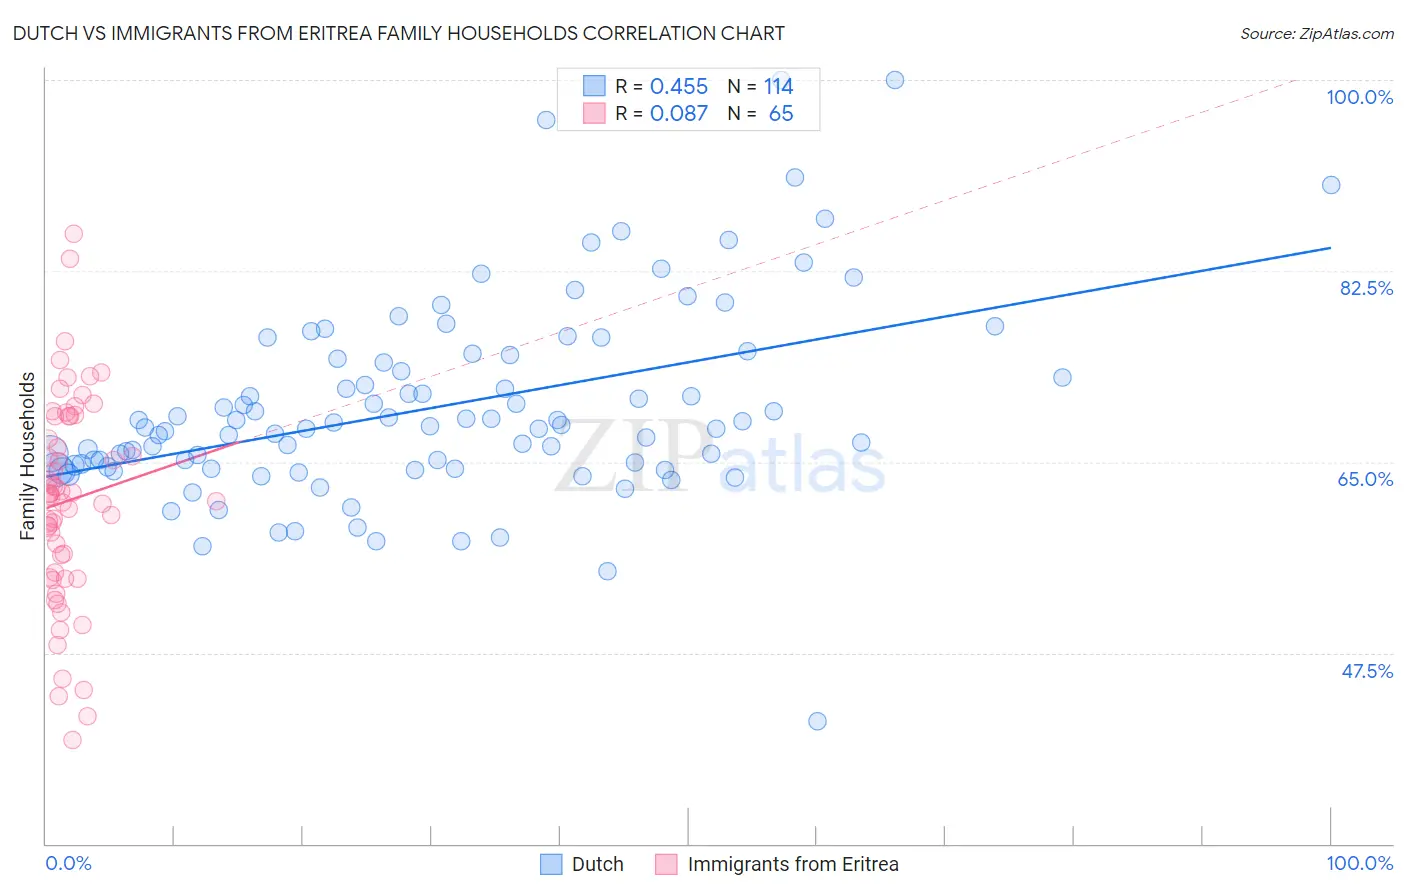
Dutch vs Immigrants from Eritrea Family Households Correlation Chart
The statistical analysis conducted on geographies consisting of 553,876,441 people shows a moderate positive correlation between the proportion of Dutch and percentage of family households in the United States with a correlation coefficient (R) of 0.455 and weighted average of 64.9%. Similarly, the statistical analysis conducted on geographies consisting of 104,847,164 people shows a slight positive correlation between the proportion of Immigrants from Eritrea and percentage of family households in the United States with a correlation coefficient (R) of 0.087 and weighted average of 60.8%, a difference of 6.8%.
Family Households Correlation Summary
| Measurement | Dutch | Immigrants from Eritrea |
| Minimum | 41.2% | 39.5% |
| Maximum | 100.0% | 85.9% |
| Range | 58.8% | 46.3% |
| Mean | 70.0% | 61.4% |
| Median | 68.2% | 61.9% |
| Interquartile 25% (IQ1) | 64.5% | 54.6% |
| Interquartile 75% (IQ3) | 74.5% | 69.2% |
| Interquartile Range (IQR) | 9.9% | 14.6% |
| Standard Deviation (Sample) | 9.1% | 9.4% |
| Standard Deviation (Population) | 9.1% | 9.3% |
Similar Demographics by Family Households
Demographics Similar to Dutch by Family Households
In terms of family households, the demographic groups most similar to Dutch are Ecuadorian (65.0%, a difference of 0.020%), Immigrants from Iraq (65.0%, a difference of 0.020%), Cherokee (65.0%, a difference of 0.020%), Immigrants from Eastern Asia (64.9%, a difference of 0.040%), and Argentinean (65.0%, a difference of 0.050%).
| Demographics | Rating | Rank | Family Households |
| Europeans | 96.8 /100 | #111 | Exceptional 65.0% |
| Immigrants | Jordan | 96.5 /100 | #112 | Exceptional 65.0% |
| Spanish | 96.2 /100 | #113 | Exceptional 65.0% |
| Argentineans | 95.7 /100 | #114 | Exceptional 65.0% |
| Ecuadorians | 95.4 /100 | #115 | Exceptional 65.0% |
| Immigrants | Iraq | 95.4 /100 | #116 | Exceptional 65.0% |
| Cherokee | 95.3 /100 | #117 | Exceptional 65.0% |
| Dutch | 95.1 /100 | #118 | Exceptional 64.9% |
| Immigrants | Eastern Asia | 94.4 /100 | #119 | Exceptional 64.9% |
| Immigrants | Oceania | 94.2 /100 | #120 | Exceptional 64.9% |
| Hungarians | 94.0 /100 | #121 | Exceptional 64.9% |
| Hmong | 93.4 /100 | #122 | Exceptional 64.9% |
| Choctaw | 93.4 /100 | #123 | Exceptional 64.9% |
| Immigrants | Argentina | 92.8 /100 | #124 | Exceptional 64.9% |
| Immigrants | Belize | 92.7 /100 | #125 | Exceptional 64.9% |
Demographics Similar to Immigrants from Eritrea by Family Households
In terms of family households, the demographic groups most similar to Immigrants from Eritrea are German Russian (60.9%, a difference of 0.14%), Soviet Union (60.9%, a difference of 0.14%), Immigrants from Saudi Arabia (60.7%, a difference of 0.20%), Carpatho Rusyn (61.1%, a difference of 0.42%), and Immigrants from Eastern Africa (61.1%, a difference of 0.54%).
| Demographics | Rating | Rank | Family Households |
| Immigrants | France | 0.0 /100 | #331 | Tragic 61.3% |
| Ethiopians | 0.0 /100 | #332 | Tragic 61.2% |
| Immigrants | Ethiopia | 0.0 /100 | #333 | Tragic 61.2% |
| Immigrants | Eastern Africa | 0.0 /100 | #334 | Tragic 61.1% |
| Carpatho Rusyns | 0.0 /100 | #335 | Tragic 61.1% |
| German Russians | 0.0 /100 | #336 | Tragic 60.9% |
| Soviet Union | 0.0 /100 | #337 | Tragic 60.9% |
| Immigrants | Eritrea | 0.0 /100 | #338 | Tragic 60.8% |
| Immigrants | Saudi Arabia | 0.0 /100 | #339 | Tragic 60.7% |
| Immigrants | Sudan | 0.0 /100 | #340 | Tragic 60.2% |
| Immigrants | Senegal | 0.0 /100 | #341 | Tragic 60.1% |
| Sudanese | 0.0 /100 | #342 | Tragic 60.0% |
| Senegalese | 0.0 /100 | #343 | Tragic 59.8% |
| Immigrants | Congo | 0.0 /100 | #344 | Tragic 59.2% |
| Immigrants | Zaire | 0.0 /100 | #345 | Tragic 59.2% |