Seminole vs Immigrants from Eritrea Family Households

COMPARE

Seminole
Race
Ancestry
AfghanAfricanAlaska NativeAlaskan AthabascanAlbanianAleutAlsatianAmericanApacheArabArapahoArgentineanArmenianAssyrian/Chaldean/SyriacAustralianAustrianBahamianBangladeshiBarbadianBasqueBelgianBelizeanBermudanBhutaneseBlackfeetBolivianBrazilianBritishBritish West IndianBulgarianBurmeseCajunCambodianCanadianCape VerdeanCarpatho RusynCelticCentral AmericanCentral American IndianCherokeeCheyenneChickasawChileanChineseChippewaChoctawColombianColvilleComancheCosta RicanCreeCreekCroatianCrowCubanCypriotCzechCzechoslovakianDanishDelawareDominicanDutchDutch West IndianEastern EuropeanEcuadorianEgyptianEnglishEstonianEthiopianEuropeanFijianFilipinoFinnishFrenchFrench American IndianFrench CanadianGermanGerman RussianGhanaianGreekGuamanian/ChamorroGuatemalanGuyaneseHaitianHmongHonduranHopiHoumaHungarianIcelanderIndian (Asian)IndonesianInupiatIranianIraqiIrishIroquoisIsraeliItalianJamaicanJapaneseJordanianKenyanKiowaKoreanLaotianLatvianLebaneseLiberianLithuanianLumbeeLuxembourgerMacedonianMalaysianMalteseMarshalleseMenomineeMexicanMexican American IndianMongolianMoroccanNative HawaiianNavajoNepaleseNew ZealanderNicaraguanNigerianNorthern EuropeanNorwegianOkinawanOsageOttawaPaiutePakistaniPalestinianPanamanianParaguayanPennsylvania GermanPeruvianPimaPolishPortuguesePotawatomiPuebloPuerto RicanPuget Sound SalishRomanianRussianSalvadoranSamoanScandinavianScotch-IrishScottishSeminoleSenegaleseSerbianShoshoneSierra LeoneanSiouxSlavicSlovakSloveneSomaliSouth AfricanSouth AmericanSouth American IndianSoviet UnionSpaniardSpanishSpanish AmericanSpanish American IndianSri LankanSubsaharan AfricanSudaneseSwedishSwissSyrianTaiwaneseThaiTlingit-HaidaTohono O'OdhamTonganTrinidadian and TobagonianTsimshianTurkishU.S. Virgin IslanderUgandanUkrainianUruguayanUteVenezuelanVietnameseWelshWest IndianYakamaYaquiYugoslavianYumanYup'ikZimbabwean
Immigration
NonimmigrantsImmigrantsAfghanistanAfricaAlbaniaArgentinaArmeniaAsiaAustraliaAustriaBahamasBangladeshBarbadosBelarusBelgiumBelizeBoliviaBosnia and HerzegovinaBrazilBulgariaBurma/MyanmarCabo VerdeCambodiaCameroonCanadaCaribbeanCentral AmericaChileChinaColombiaCongoCosta RicaCroatiaCubaCzechoslovakiaDenmarkDominicaDominican RepublicEastern AfricaEastern AsiaEastern EuropeEcuadorEgyptEl SalvadorEnglandEthiopiaEuropeFijiFranceGermanyGhanaGreeceGrenadaGuatemalaGuyanaHaitiHondurasHong KongHungaryIndiaIndonesiaIranIraqIrelandIsraelItalyJamaicaJapanJordanKazakhstanKenyaKoreaKuwaitLaosLatin AmericaLatviaLebanonLiberiaLithuaniaMalaysiaMexicoMicronesiaMiddle AfricaMoldovaMoroccoNepalNetherlandsNicaraguaNigeriaNorth AmericaNorth MacedoniaNorthern AfricaNorthern EuropeNorwayOceaniaPakistanPanamaPeruPhilippinesPolandPortugalRomaniaRussiaSaudi ArabiaScotlandSenegalSerbiaSierra LeoneSingaporeSomaliaSouth AfricaSouth AmericaSouth Central AsiaSouth Eastern AsiaSouthern EuropeSpainSri LankaSt. Vincent and the GrenadinesSudanSwedenSwitzerlandSyriaTaiwanThailandTrinidad and TobagoTurkeyUgandaUkraineUruguayUzbekistanVenezuelaVietnamWest IndiesWestern AfricaWestern AsiaWestern EuropeYemenZaireZimbabweAzores
Immigrants from Eritrea
Race
Ancestry
AfghanAfricanAlaska NativeAlaskan AthabascanAlbanianAleutAlsatianAmericanApacheArabArapahoArgentineanArmenianAssyrian/Chaldean/SyriacAustralianAustrianBahamianBangladeshiBarbadianBasqueBelgianBelizeanBermudanBhutaneseBlackfeetBolivianBrazilianBritishBritish West IndianBulgarianBurmeseCajunCambodianCanadianCape VerdeanCarpatho RusynCelticCentral AmericanCentral American IndianCherokeeCheyenneChickasawChileanChineseChippewaChoctawColombianColvilleComancheCosta RicanCreeCreekCroatianCrowCubanCypriotCzechCzechoslovakianDanishDelawareDominicanDutchDutch West IndianEastern EuropeanEcuadorianEgyptianEnglishEstonianEthiopianEuropeanFijianFilipinoFinnishFrenchFrench American IndianFrench CanadianGermanGerman RussianGhanaianGreekGuamanian/ChamorroGuatemalanGuyaneseHaitianHmongHonduranHopiHoumaHungarianIcelanderIndian (Asian)IndonesianInupiatIranianIraqiIrishIroquoisIsraeliItalianJamaicanJapaneseJordanianKenyanKiowaKoreanLaotianLatvianLebaneseLiberianLithuanianLumbeeLuxembourgerMacedonianMalaysianMalteseMarshalleseMenomineeMexicanMexican American IndianMongolianMoroccanNative HawaiianNavajoNepaleseNew ZealanderNicaraguanNigerianNorthern EuropeanNorwegianOkinawanOsageOttawaPaiutePakistaniPalestinianPanamanianParaguayanPennsylvania GermanPeruvianPimaPolishPortuguesePotawatomiPuebloPuerto RicanPuget Sound SalishRomanianRussianSalvadoranSamoanScandinavianScotch-IrishScottishSenegaleseSerbianShoshoneSierra LeoneanSiouxSlavicSlovakSloveneSomaliSouth AfricanSouth AmericanSouth American IndianSoviet UnionSpaniardSpanishSpanish AmericanSpanish American IndianSri LankanSubsaharan AfricanSudaneseSwedishSwissSyrianTaiwaneseThaiTlingit-HaidaTohono O'OdhamTonganTrinidadian and TobagonianTsimshianTurkishU.S. Virgin IslanderUgandanUkrainianUruguayanUteVenezuelanVietnameseWelshWest IndianYakamaYaquiYugoslavianYumanYup'ikZimbabwean
Immigration
NonimmigrantsImmigrantsAfghanistanAfricaAlbaniaArgentinaArmeniaAsiaAustraliaAustriaBahamasBangladeshBarbadosBelarusBelgiumBelizeBoliviaBosnia and HerzegovinaBrazilBulgariaBurma/MyanmarCabo VerdeCambodiaCameroonCanadaCaribbeanCentral AmericaChileChinaColombiaCongoCosta RicaCroatiaCubaCzechoslovakiaDenmarkDominicaDominican RepublicEastern AfricaEastern AsiaEastern EuropeEcuadorEgyptEl SalvadorEnglandEritreaEthiopiaEuropeFijiFranceGermanyGhanaGreeceGrenadaGuatemalaGuyanaHaitiHondurasHong KongHungaryIndiaIndonesiaIranIraqIrelandIsraelItalyJamaicaJapanJordanKazakhstanKenyaKoreaKuwaitLaosLatin AmericaLatviaLebanonLiberiaLithuaniaMalaysiaMexicoMicronesiaMiddle AfricaMoldovaMoroccoNepalNetherlandsNicaraguaNigeriaNorth AmericaNorth MacedoniaNorthern AfricaNorthern EuropeNorwayOceaniaPakistanPanamaPeruPhilippinesPolandPortugalRomaniaRussiaSaudi ArabiaScotlandSenegalSerbiaSierra LeoneSingaporeSomaliaSouth AfricaSouth AmericaSouth Central AsiaSouth Eastern AsiaSouthern EuropeSpainSri LankaSt. Vincent and the GrenadinesSudanSwedenSwitzerlandSyriaTaiwanThailandTrinidad and TobagoTurkeyUgandaUkraineUruguayUzbekistanVenezuelaVietnamWest IndiesWestern AfricaWestern AsiaWestern EuropeYemenZaireZimbabweAzores
Family Households
Income
Poverty
Unemployment
Labor Participation
Family Structure
Vehicle Availability
Education Level
Disability

Family Households Comparison

Seminole

Immigrants from Eritrea

Poor
Tragic
64.0%
FAMILY HOUSEHOLDS
18.9/ 100
METRIC RATING
197th/ 347
METRIC RANK
60.8%
FAMILY HOUSEHOLDS
0.0/ 100
METRIC RATING
338th/ 347
METRIC RANK

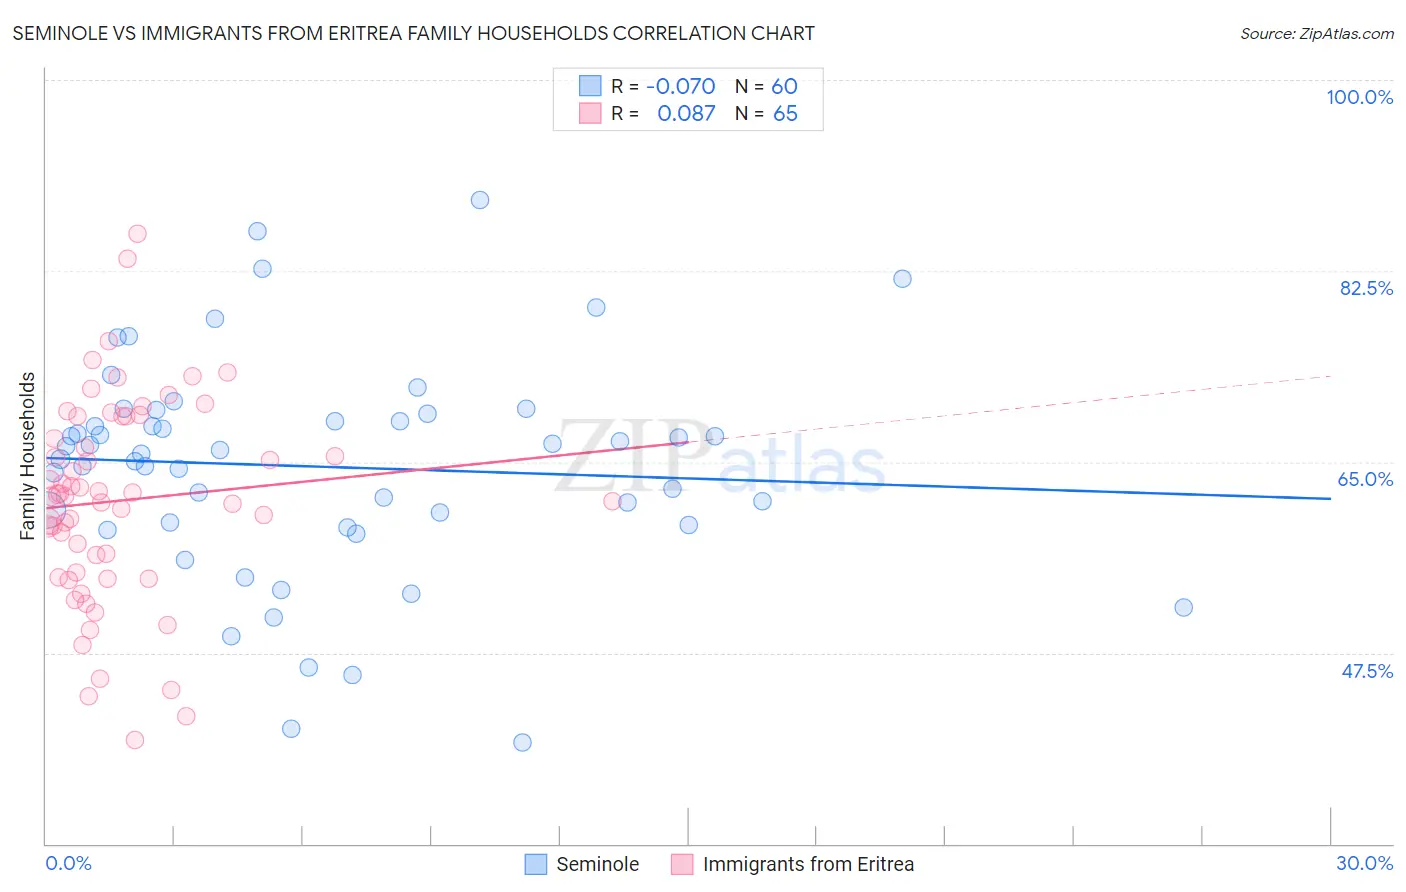
Seminole vs Immigrants from Eritrea Family Households Correlation Chart

The statistical analysis conducted on geographies consisting of 118,298,678 people shows a slight negative correlation between the proportion of Seminole and percentage of family households in the United States with a correlation coefficient (R) of -0.070 and weighted average of 64.0%. Similarly, the statistical analysis conducted on geographies consisting of 104,847,164 people shows a slight positive correlation between the proportion of Immigrants from Eritrea and percentage of family households in the United States with a correlation coefficient (R) of 0.087 and weighted average of 60.8%, a difference of 5.2%.
Seminole vs Immigrants from Eritrea Family Households

Family Households Correlation Summary

MeasurementSeminoleImmigrants from Eritrea
Minimum39.3%39.5%
Maximum89.0%85.9%
Range49.7%46.3%
Mean64.6%61.4%
Median65.9%61.9%
Interquartile 25% (IQ1)59.4%54.6%
Interquartile 75% (IQ3)69.1%69.2%
Interquartile Range (IQR)9.7%14.6%
Standard Deviation (Sample)10.1%9.4%
Standard Deviation (Population)10.0%9.3%

Similar Demographics by Family Households

Demographics Similar to Seminole by Family Households

In terms of family households, the demographic groups most similar to Seminole are Polish (64.0%, a difference of 0.0%), Immigrants from Canada (64.0%, a difference of 0.010%), Slavic (64.0%, a difference of 0.010%), Immigrants from North America (64.0%, a difference of 0.020%), and Immigrants from Malaysia (64.0%, a difference of 0.020%).
DemographicsRating | RankFamily Households
Zimbabweans
24.7
/100
|
#190
Fair
64.1%
Arabs
24.5
/100
|
#191
Fair
64.1%
Lithuanians
23.8
/100
|
#192
Fair
64.0%
French
23.7
/100
|
#193
Fair
64.0%
Paiute
22.2
/100
|
#194
Fair
64.0%
Immigrants | North America
20.0
/100
|
#195
Poor
64.0%
Immigrants | Canada
19.2
/100
|
#196
Poor
64.0%
Seminole
18.9
/100
|
#197
Poor
64.0%
Poles
18.9
/100
|
#198
Poor
64.0%
Slavs
18.6
/100
|
#199
Poor
64.0%
Immigrants | Malaysia
17.9
/100
|
#200
Poor
64.0%
Immigrants | Eastern Europe
17.2
/100
|
#201
Poor
64.0%
Iranians
13.5
/100
|
#202
Poor
63.9%
Norwegians
13.2
/100
|
#203
Poor
63.9%
Immigrants | Uruguay
12.8
/100
|
#204
Poor
63.9%

Demographics Similar to Immigrants from Eritrea by Family Households

In terms of family households, the demographic groups most similar to Immigrants from Eritrea are German Russian (60.9%, a difference of 0.14%), Soviet Union (60.9%, a difference of 0.14%), Immigrants from Saudi Arabia (60.7%, a difference of 0.20%), Carpatho Rusyn (61.1%, a difference of 0.42%), and Immigrants from Eastern Africa (61.1%, a difference of 0.54%).
DemographicsRating | RankFamily Households
Immigrants | France
0.0
/100
|
#331
Tragic
61.3%
Ethiopians
0.0
/100
|
#332
Tragic
61.2%
Immigrants | Ethiopia
0.0
/100
|
#333
Tragic
61.2%
Immigrants | Eastern Africa
0.0
/100
|
#334
Tragic
61.1%
Carpatho Rusyns
0.0
/100
|
#335
Tragic
61.1%
German Russians
0.0
/100
|
#336
Tragic
60.9%
Soviet Union
0.0
/100
|
#337
Tragic
60.9%
Immigrants | Eritrea
0.0
/100
|
#338
Tragic
60.8%
Immigrants | Saudi Arabia
0.0
/100
|
#339
Tragic
60.7%
Immigrants | Sudan
0.0
/100
|
#340
Tragic
60.2%
Immigrants | Senegal
0.0
/100
|
#341
Tragic
60.1%
Sudanese
0.0
/100
|
#342
Tragic
60.0%
Senegalese
0.0
/100
|
#343
Tragic
59.8%
Immigrants | Congo
0.0
/100
|
#344
Tragic
59.2%
Immigrants | Zaire
0.0
/100
|
#345
Tragic
59.2%