Dutch vs Immigrants from Eritrea Male Unemployment
COMPARE
Dutch
Immigrants from Eritrea
Male Unemployment
Male Unemployment Comparison
Dutch
Immigrants from Eritrea
4.8%
MALE UNEMPLOYMENT
99.9/ 100
METRIC RATING
26th/ 347
METRIC RANK
5.0%
MALE UNEMPLOYMENT
96.0/ 100
METRIC RATING
83rd/ 347
METRIC RANK
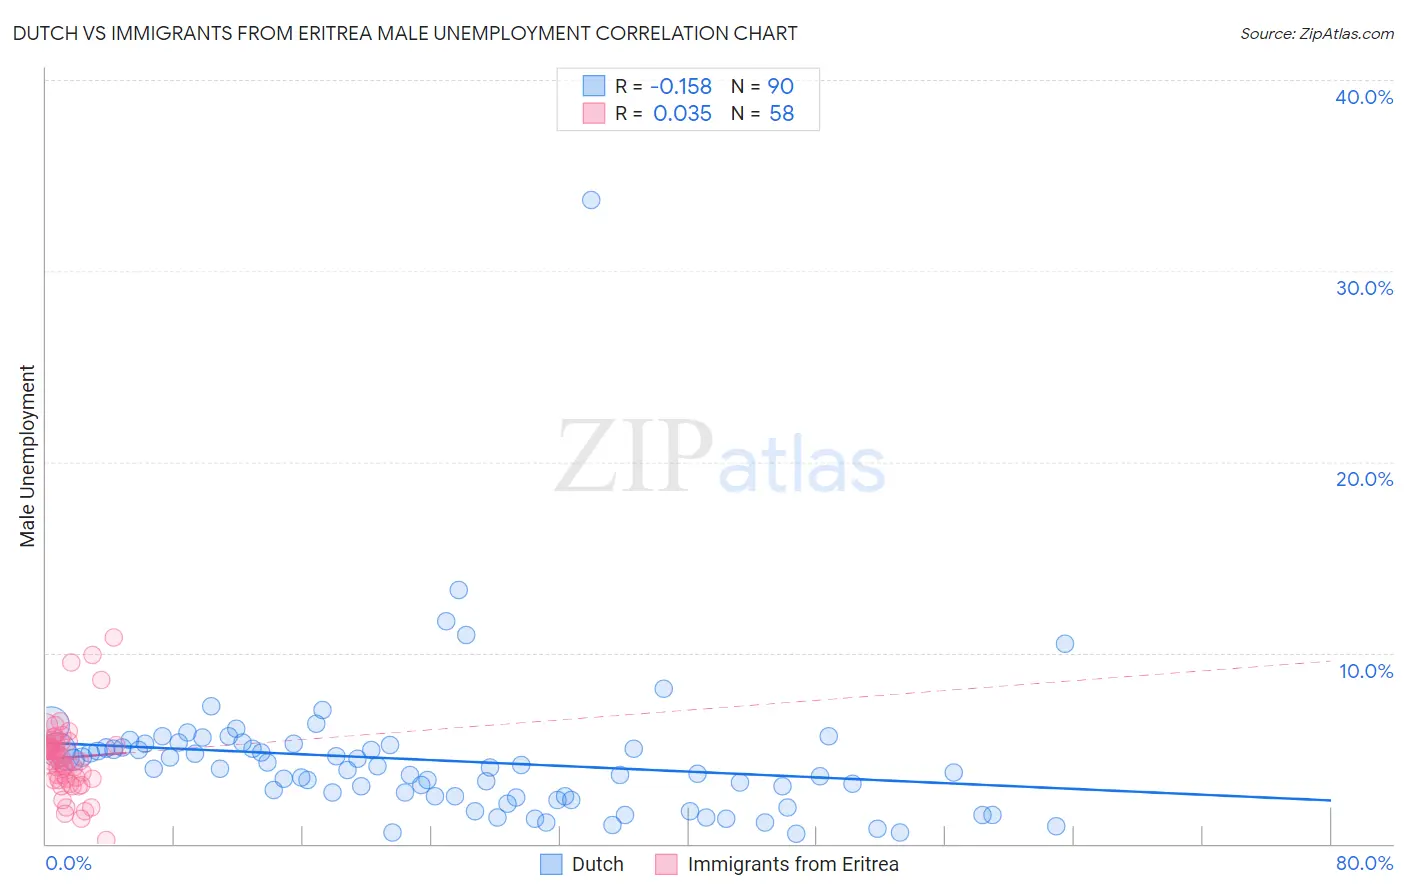
Dutch vs Immigrants from Eritrea Male Unemployment Correlation Chart
The statistical analysis conducted on geographies consisting of 544,964,773 people shows a poor negative correlation between the proportion of Dutch and unemployment rate among males in the United States with a correlation coefficient (R) of -0.158 and weighted average of 4.8%. Similarly, the statistical analysis conducted on geographies consisting of 104,807,981 people shows no correlation between the proportion of Immigrants from Eritrea and unemployment rate among males in the United States with a correlation coefficient (R) of 0.035 and weighted average of 5.0%, a difference of 5.7%.
Male Unemployment Correlation Summary
| Measurement | Dutch | Immigrants from Eritrea |
| Minimum | 0.50% | 0.20% |
| Maximum | 33.7% | 10.8% |
| Range | 33.2% | 10.6% |
| Mean | 4.4% | 4.5% |
| Median | 3.9% | 4.4% |
| Interquartile 25% (IQ1) | 2.5% | 3.4% |
| Interquartile 75% (IQ3) | 5.1% | 5.3% |
| Interquartile Range (IQR) | 2.6% | 1.9% |
| Standard Deviation (Sample) | 3.9% | 1.9% |
| Standard Deviation (Population) | 3.9% | 1.9% |
Similar Demographics by Male Unemployment
Demographics Similar to Dutch by Male Unemployment
In terms of male unemployment, the demographic groups most similar to Dutch are Zimbabwean (4.8%, a difference of 0.020%), Immigrants from South Central Asia (4.8%, a difference of 0.12%), Tongan (4.8%, a difference of 0.15%), Carpatho Rusyn (4.8%, a difference of 0.20%), and Belgian (4.8%, a difference of 0.20%).
| Demographics | Rating | Rank | Male Unemployment |
| Europeans | 99.9 /100 | #19 | Exceptional 4.8% |
| Pennsylvania Germans | 99.9 /100 | #20 | Exceptional 4.8% |
| Immigrants | Taiwan | 99.9 /100 | #21 | Exceptional 4.8% |
| Carpatho Rusyns | 99.9 /100 | #22 | Exceptional 4.8% |
| Tongans | 99.9 /100 | #23 | Exceptional 4.8% |
| Immigrants | South Central Asia | 99.9 /100 | #24 | Exceptional 4.8% |
| Zimbabweans | 99.9 /100 | #25 | Exceptional 4.8% |
| Dutch | 99.9 /100 | #26 | Exceptional 4.8% |
| Belgians | 99.9 /100 | #27 | Exceptional 4.8% |
| Bulgarians | 99.8 /100 | #28 | Exceptional 4.8% |
| Scottish | 99.8 /100 | #29 | Exceptional 4.8% |
| British | 99.8 /100 | #30 | Exceptional 4.8% |
| Sudanese | 99.8 /100 | #31 | Exceptional 4.8% |
| Immigrants | Nepal | 99.8 /100 | #32 | Exceptional 4.8% |
| Latvians | 99.7 /100 | #33 | Exceptional 4.8% |
Demographics Similar to Immigrants from Eritrea by Male Unemployment
In terms of male unemployment, the demographic groups most similar to Immigrants from Eritrea are Chilean (5.0%, a difference of 0.060%), Argentinean (5.0%, a difference of 0.090%), French (5.0%, a difference of 0.090%), Serbian (5.1%, a difference of 0.12%), and South African (5.0%, a difference of 0.14%).
| Demographics | Rating | Rank | Male Unemployment |
| Immigrants | Sudan | 96.5 /100 | #76 | Exceptional 5.0% |
| Iranians | 96.4 /100 | #77 | Exceptional 5.0% |
| Immigrants | Northern Europe | 96.4 /100 | #78 | Exceptional 5.0% |
| South Africans | 96.4 /100 | #79 | Exceptional 5.0% |
| Argentineans | 96.2 /100 | #80 | Exceptional 5.0% |
| French | 96.2 /100 | #81 | Exceptional 5.0% |
| Chileans | 96.2 /100 | #82 | Exceptional 5.0% |
| Immigrants | Eritrea | 96.0 /100 | #83 | Exceptional 5.0% |
| Serbians | 95.7 /100 | #84 | Exceptional 5.1% |
| Immigrants | North Macedonia | 95.6 /100 | #85 | Exceptional 5.1% |
| Maltese | 95.5 /100 | #86 | Exceptional 5.1% |
| Immigrants | Romania | 95.4 /100 | #87 | Exceptional 5.1% |
| Immigrants | Sri Lanka | 94.9 /100 | #88 | Exceptional 5.1% |
| Immigrants | Australia | 94.7 /100 | #89 | Exceptional 5.1% |
| Okinawans | 94.7 /100 | #90 | Exceptional 5.1% |