Syrian vs Immigrants from Eritrea Family Households
COMPARE
Syrian
Immigrants from Eritrea
Family Households
Family Households Comparison
Syrians
Immigrants from Eritrea
64.5%
FAMILY HOUSEHOLDS
75.2/ 100
METRIC RATING
151st/ 347
METRIC RANK
60.8%
FAMILY HOUSEHOLDS
0.0/ 100
METRIC RATING
338th/ 347
METRIC RANK
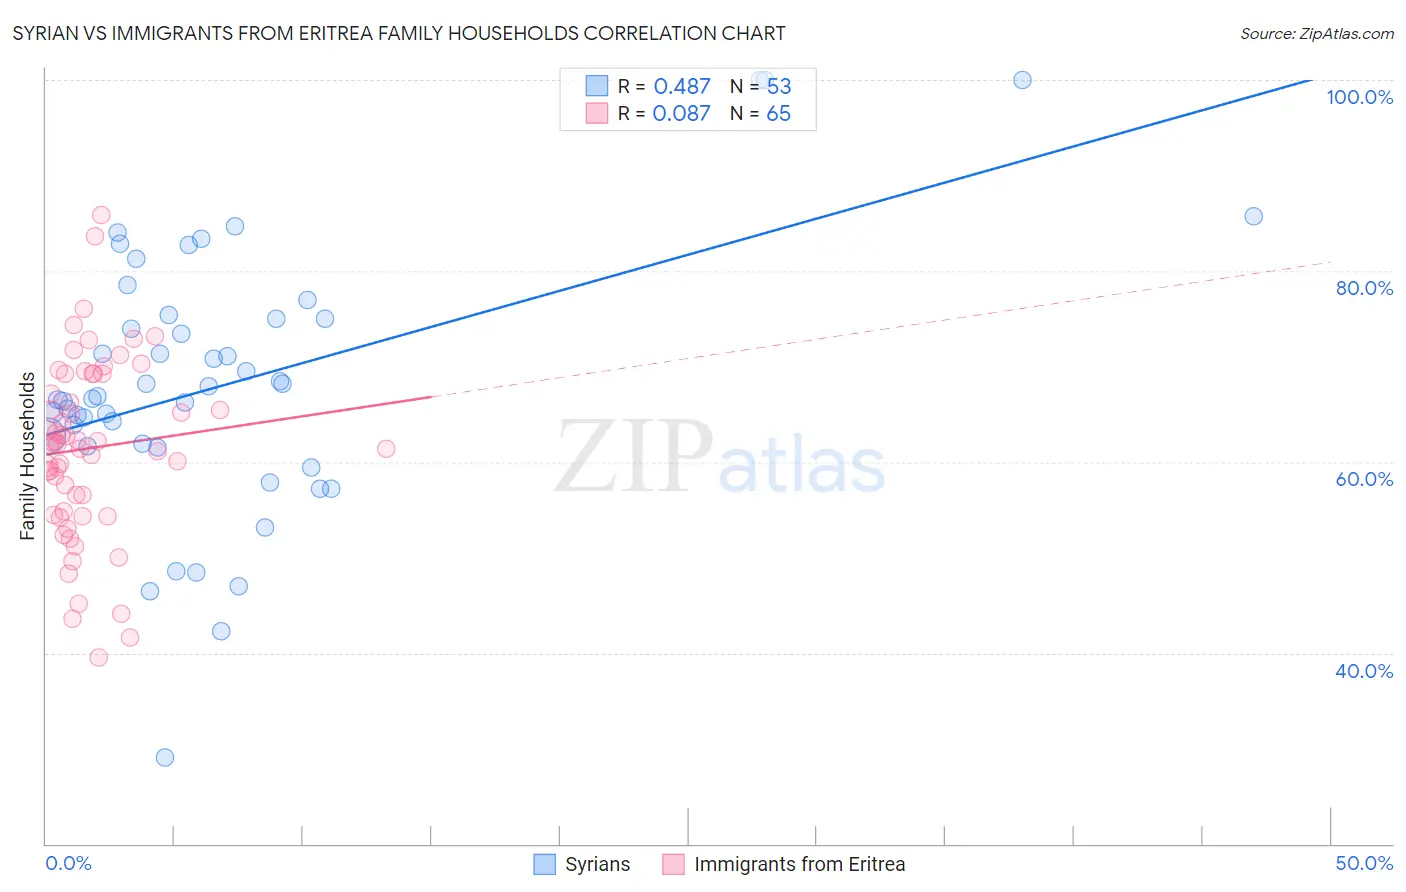
Syrian vs Immigrants from Eritrea Family Households Correlation Chart
The statistical analysis conducted on geographies consisting of 266,181,919 people shows a moderate positive correlation between the proportion of Syrians and percentage of family households in the United States with a correlation coefficient (R) of 0.487 and weighted average of 64.5%. Similarly, the statistical analysis conducted on geographies consisting of 104,847,164 people shows a slight positive correlation between the proportion of Immigrants from Eritrea and percentage of family households in the United States with a correlation coefficient (R) of 0.087 and weighted average of 60.8%, a difference of 6.1%.
Family Households Correlation Summary
| Measurement | Syrian | Immigrants from Eritrea |
| Minimum | 29.0% | 39.5% |
| Maximum | 100.0% | 85.9% |
| Range | 71.0% | 46.3% |
| Mean | 68.3% | 61.4% |
| Median | 66.9% | 61.9% |
| Interquartile 25% (IQ1) | 61.8% | 54.6% |
| Interquartile 75% (IQ3) | 75.2% | 69.2% |
| Interquartile Range (IQR) | 13.4% | 14.6% |
| Standard Deviation (Sample) | 13.8% | 9.4% |
| Standard Deviation (Population) | 13.7% | 9.3% |
Similar Demographics by Family Households
Demographics Similar to Syrians by Family Households
In terms of family households, the demographic groups most similar to Syrians are Romanian (64.5%, a difference of 0.0%), Immigrants from Chile (64.6%, a difference of 0.020%), Delaware (64.6%, a difference of 0.020%), Sioux (64.6%, a difference of 0.020%), and Immigrants from Romania (64.6%, a difference of 0.030%).
| Demographics | Rating | Rank | Family Households |
| South American Indians | 81.9 /100 | #144 | Excellent 64.6% |
| Welsh | 80.1 /100 | #145 | Excellent 64.6% |
| Immigrants | Romania | 77.0 /100 | #146 | Good 64.6% |
| Immigrants | Chile | 76.5 /100 | #147 | Good 64.6% |
| Delaware | 76.3 /100 | #148 | Good 64.6% |
| Sioux | 76.3 /100 | #149 | Good 64.6% |
| Romanians | 75.3 /100 | #150 | Good 64.5% |
| Syrians | 75.2 /100 | #151 | Good 64.5% |
| Scottish | 70.9 /100 | #152 | Good 64.5% |
| Swedes | 69.8 /100 | #153 | Good 64.5% |
| Austrians | 68.5 /100 | #154 | Good 64.5% |
| Uruguayans | 67.7 /100 | #155 | Good 64.5% |
| Czechs | 67.0 /100 | #156 | Good 64.5% |
| Canadians | 66.6 /100 | #157 | Good 64.4% |
| Lebanese | 66.4 /100 | #158 | Good 64.4% |
Demographics Similar to Immigrants from Eritrea by Family Households
In terms of family households, the demographic groups most similar to Immigrants from Eritrea are German Russian (60.9%, a difference of 0.14%), Soviet Union (60.9%, a difference of 0.14%), Immigrants from Saudi Arabia (60.7%, a difference of 0.20%), Carpatho Rusyn (61.1%, a difference of 0.42%), and Immigrants from Eastern Africa (61.1%, a difference of 0.54%).
| Demographics | Rating | Rank | Family Households |
| Immigrants | France | 0.0 /100 | #331 | Tragic 61.3% |
| Ethiopians | 0.0 /100 | #332 | Tragic 61.2% |
| Immigrants | Ethiopia | 0.0 /100 | #333 | Tragic 61.2% |
| Immigrants | Eastern Africa | 0.0 /100 | #334 | Tragic 61.1% |
| Carpatho Rusyns | 0.0 /100 | #335 | Tragic 61.1% |
| German Russians | 0.0 /100 | #336 | Tragic 60.9% |
| Soviet Union | 0.0 /100 | #337 | Tragic 60.9% |
| Immigrants | Eritrea | 0.0 /100 | #338 | Tragic 60.8% |
| Immigrants | Saudi Arabia | 0.0 /100 | #339 | Tragic 60.7% |
| Immigrants | Sudan | 0.0 /100 | #340 | Tragic 60.2% |
| Immigrants | Senegal | 0.0 /100 | #341 | Tragic 60.1% |
| Sudanese | 0.0 /100 | #342 | Tragic 60.0% |
| Senegalese | 0.0 /100 | #343 | Tragic 59.8% |
| Immigrants | Congo | 0.0 /100 | #344 | Tragic 59.2% |
| Immigrants | Zaire | 0.0 /100 | #345 | Tragic 59.2% |