Dutch vs Tsimshian Family Households
COMPARE
Dutch
Tsimshian
Family Households
Family Households Comparison
Dutch
Tsimshian
64.9%
FAMILY HOUSEHOLDS
95.1/ 100
METRIC RATING
118th/ 347
METRIC RANK
67.1%
FAMILY HOUSEHOLDS
100.0/ 100
METRIC RATING
37th/ 347
METRIC RANK
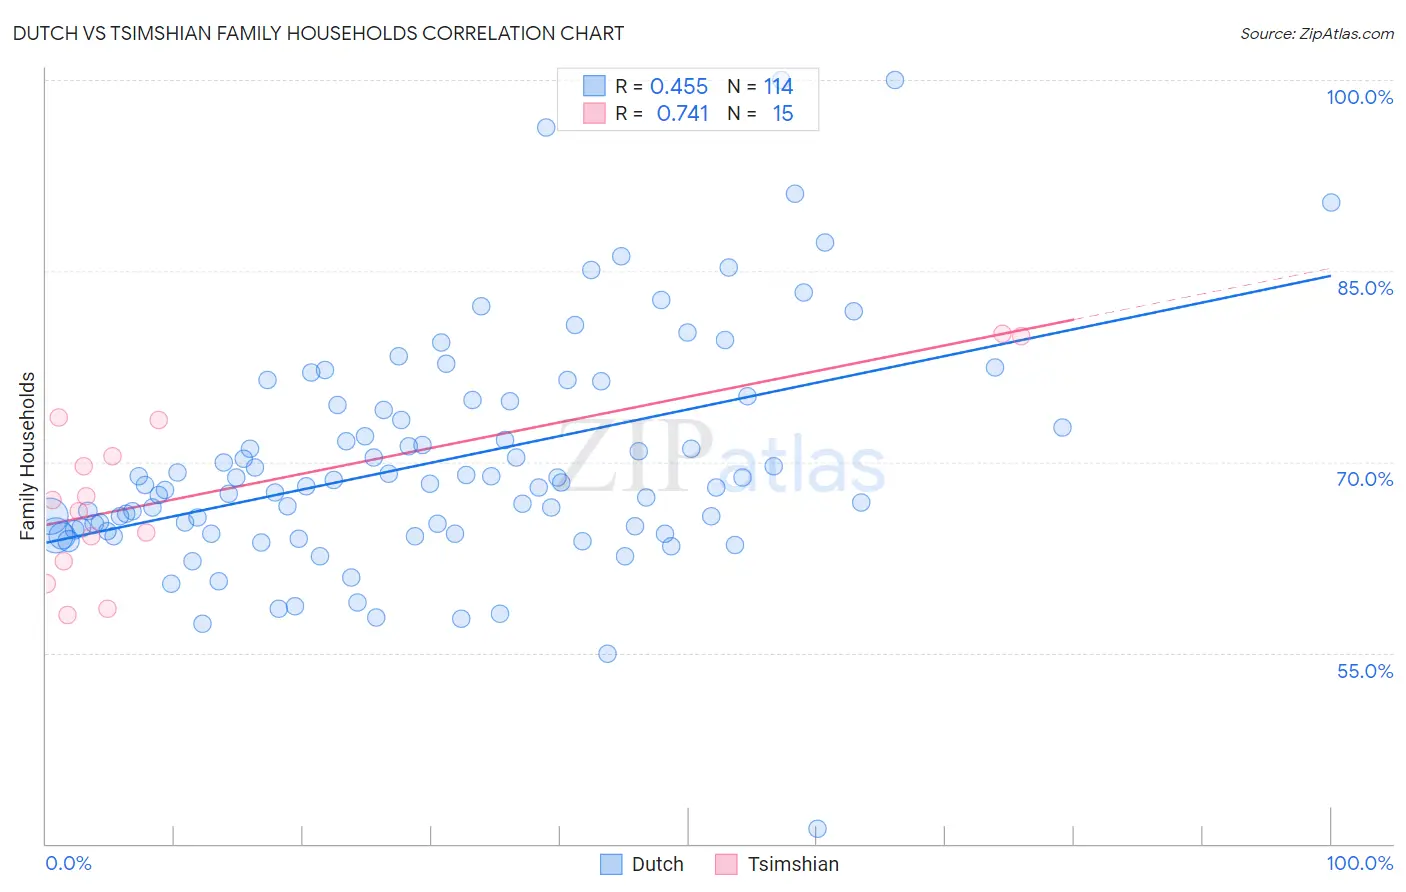
Dutch vs Tsimshian Family Households Correlation Chart
The statistical analysis conducted on geographies consisting of 553,876,441 people shows a moderate positive correlation between the proportion of Dutch and percentage of family households in the United States with a correlation coefficient (R) of 0.455 and weighted average of 64.9%. Similarly, the statistical analysis conducted on geographies consisting of 15,626,544 people shows a strong positive correlation between the proportion of Tsimshian and percentage of family households in the United States with a correlation coefficient (R) of 0.741 and weighted average of 67.1%, a difference of 3.3%.
Family Households Correlation Summary
| Measurement | Dutch | Tsimshian |
| Minimum | 41.2% | 58.0% |
| Maximum | 100.0% | 80.1% |
| Range | 58.8% | 22.1% |
| Mean | 70.0% | 67.7% |
| Median | 68.2% | 67.0% |
| Interquartile 25% (IQ1) | 64.5% | 62.2% |
| Interquartile 75% (IQ3) | 74.5% | 73.3% |
| Interquartile Range (IQR) | 9.9% | 11.1% |
| Standard Deviation (Sample) | 9.1% | 6.9% |
| Standard Deviation (Population) | 9.1% | 6.7% |
Similar Demographics by Family Households
Demographics Similar to Dutch by Family Households
In terms of family households, the demographic groups most similar to Dutch are Ecuadorian (65.0%, a difference of 0.020%), Immigrants from Iraq (65.0%, a difference of 0.020%), Cherokee (65.0%, a difference of 0.020%), Immigrants from Eastern Asia (64.9%, a difference of 0.040%), and Argentinean (65.0%, a difference of 0.050%).
| Demographics | Rating | Rank | Family Households |
| Europeans | 96.8 /100 | #111 | Exceptional 65.0% |
| Immigrants | Jordan | 96.5 /100 | #112 | Exceptional 65.0% |
| Spanish | 96.2 /100 | #113 | Exceptional 65.0% |
| Argentineans | 95.7 /100 | #114 | Exceptional 65.0% |
| Ecuadorians | 95.4 /100 | #115 | Exceptional 65.0% |
| Immigrants | Iraq | 95.4 /100 | #116 | Exceptional 65.0% |
| Cherokee | 95.3 /100 | #117 | Exceptional 65.0% |
| Dutch | 95.1 /100 | #118 | Exceptional 64.9% |
| Immigrants | Eastern Asia | 94.4 /100 | #119 | Exceptional 64.9% |
| Immigrants | Oceania | 94.2 /100 | #120 | Exceptional 64.9% |
| Hungarians | 94.0 /100 | #121 | Exceptional 64.9% |
| Hmong | 93.4 /100 | #122 | Exceptional 64.9% |
| Choctaw | 93.4 /100 | #123 | Exceptional 64.9% |
| Immigrants | Argentina | 92.8 /100 | #124 | Exceptional 64.9% |
| Immigrants | Belize | 92.7 /100 | #125 | Exceptional 64.9% |
Demographics Similar to Tsimshian by Family Households
In terms of family households, the demographic groups most similar to Tsimshian are Peruvian (67.1%, a difference of 0.070%), Tohono O'odham (67.1%, a difference of 0.080%), Mexican American Indian (67.0%, a difference of 0.10%), Immigrants from El Salvador (67.0%, a difference of 0.12%), and Salvadoran (67.2%, a difference of 0.13%).
| Demographics | Rating | Rank | Family Households |
| Immigrants | Peru | 100.0 /100 | #30 | Exceptional 67.2% |
| Immigrants | Latin America | 100.0 /100 | #31 | Exceptional 67.2% |
| Nepalese | 100.0 /100 | #32 | Exceptional 67.2% |
| Salvadorans | 100.0 /100 | #33 | Exceptional 67.2% |
| Thais | 100.0 /100 | #34 | Exceptional 67.2% |
| Tohono O'odham | 100.0 /100 | #35 | Exceptional 67.1% |
| Peruvians | 100.0 /100 | #36 | Exceptional 67.1% |
| Tsimshian | 100.0 /100 | #37 | Exceptional 67.1% |
| Mexican American Indians | 100.0 /100 | #38 | Exceptional 67.0% |
| Immigrants | El Salvador | 100.0 /100 | #39 | Exceptional 67.0% |
| Guamanians/Chamorros | 100.0 /100 | #40 | Exceptional 66.6% |
| Immigrants | Bolivia | 100.0 /100 | #41 | Exceptional 66.6% |
| Menominee | 100.0 /100 | #42 | Exceptional 66.5% |
| Apache | 100.0 /100 | #43 | Exceptional 66.5% |
| Asians | 100.0 /100 | #44 | Exceptional 66.5% |