Guatemalan vs Immigrants from Eritrea Family Households
COMPARE
Guatemalan
Immigrants from Eritrea
Family Households
Family Households Comparison
Guatemalans
Immigrants from Eritrea
65.2%
FAMILY HOUSEHOLDS
98.6/ 100
METRIC RATING
97th/ 347
METRIC RANK
60.8%
FAMILY HOUSEHOLDS
0.0/ 100
METRIC RATING
338th/ 347
METRIC RANK
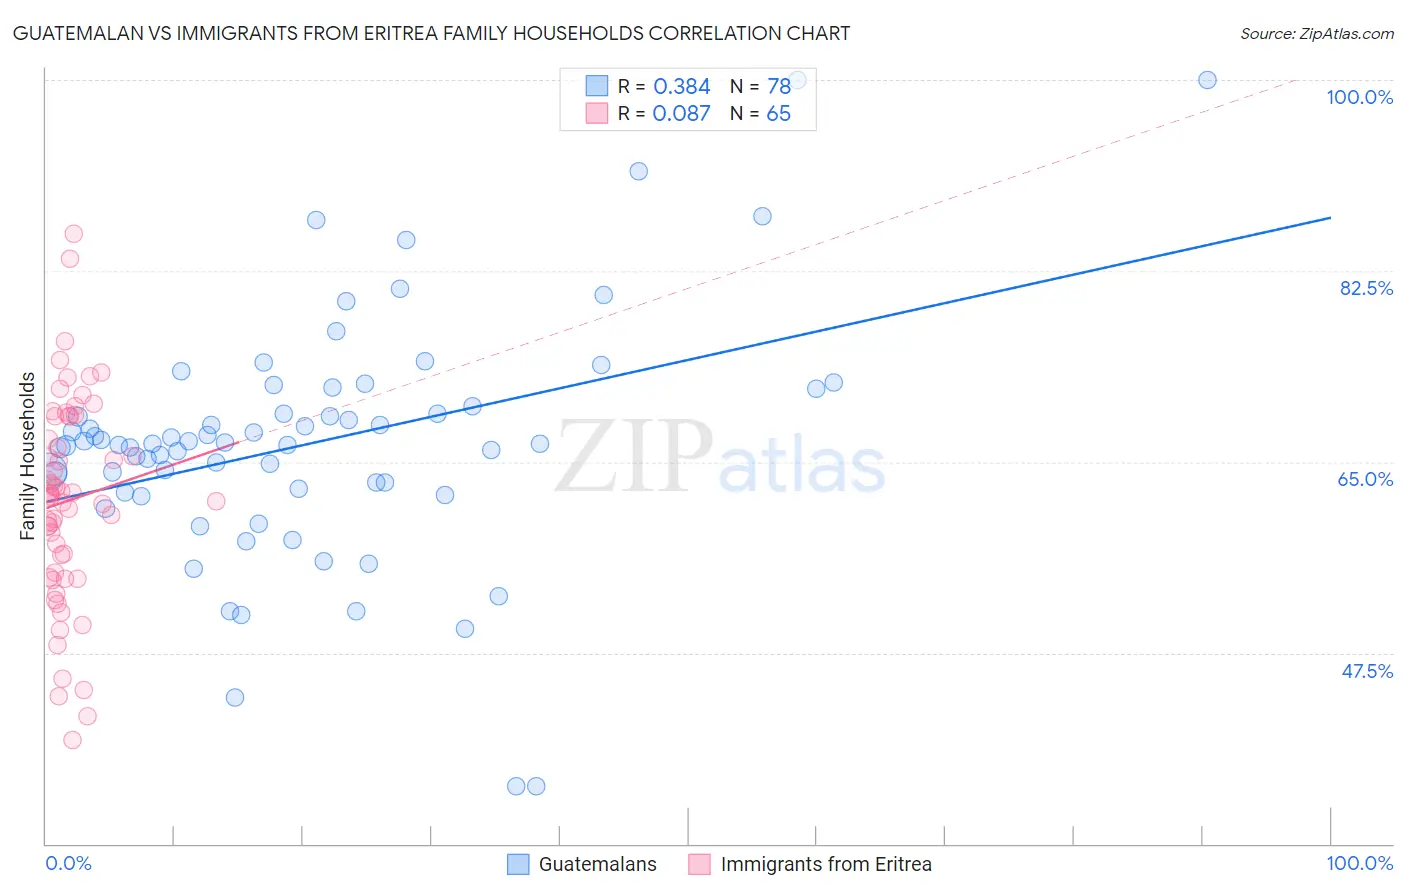
Guatemalan vs Immigrants from Eritrea Family Households Correlation Chart
The statistical analysis conducted on geographies consisting of 409,298,089 people shows a mild positive correlation between the proportion of Guatemalans and percentage of family households in the United States with a correlation coefficient (R) of 0.384 and weighted average of 65.2%. Similarly, the statistical analysis conducted on geographies consisting of 104,847,164 people shows a slight positive correlation between the proportion of Immigrants from Eritrea and percentage of family households in the United States with a correlation coefficient (R) of 0.087 and weighted average of 60.8%, a difference of 7.2%.
Family Households Correlation Summary
| Measurement | Guatemalan | Immigrants from Eritrea |
| Minimum | 35.3% | 39.5% |
| Maximum | 100.0% | 85.9% |
| Range | 64.7% | 46.3% |
| Mean | 66.7% | 61.4% |
| Median | 66.6% | 61.9% |
| Interquartile 25% (IQ1) | 62.6% | 54.6% |
| Interquartile 75% (IQ3) | 70.0% | 69.2% |
| Interquartile Range (IQR) | 7.5% | 14.6% |
| Standard Deviation (Sample) | 11.2% | 9.4% |
| Standard Deviation (Population) | 11.1% | 9.3% |
Similar Demographics by Family Households
Demographics Similar to Guatemalans by Family Households
In terms of family households, the demographic groups most similar to Guatemalans are Swiss (65.2%, a difference of 0.0%), Immigrants from Portugal (65.2%, a difference of 0.010%), Immigrants from Poland (65.2%, a difference of 0.030%), Immigrants from Syria (65.2%, a difference of 0.040%), and Hopi (65.3%, a difference of 0.050%).
| Demographics | Rating | Rank | Family Households |
| Immigrants | Laos | 99.1 /100 | #90 | Exceptional 65.3% |
| Crow | 98.9 /100 | #91 | Exceptional 65.3% |
| Hopi | 98.8 /100 | #92 | Exceptional 65.3% |
| Guyanese | 98.8 /100 | #93 | Exceptional 65.3% |
| Immigrants | Poland | 98.7 /100 | #94 | Exceptional 65.2% |
| Immigrants | Portugal | 98.6 /100 | #95 | Exceptional 65.2% |
| Swiss | 98.6 /100 | #96 | Exceptional 65.2% |
| Guatemalans | 98.6 /100 | #97 | Exceptional 65.2% |
| Immigrants | Syria | 98.4 /100 | #98 | Exceptional 65.2% |
| Central American Indians | 98.3 /100 | #99 | Exceptional 65.2% |
| Haitians | 98.1 /100 | #100 | Exceptional 65.2% |
| Chileans | 98.1 /100 | #101 | Exceptional 65.2% |
| Immigrants | Sri Lanka | 98.0 /100 | #102 | Exceptional 65.1% |
| Indians (Asian) | 97.9 /100 | #103 | Exceptional 65.1% |
| Spaniards | 97.8 /100 | #104 | Exceptional 65.1% |
Demographics Similar to Immigrants from Eritrea by Family Households
In terms of family households, the demographic groups most similar to Immigrants from Eritrea are German Russian (60.9%, a difference of 0.14%), Soviet Union (60.9%, a difference of 0.14%), Immigrants from Saudi Arabia (60.7%, a difference of 0.20%), Carpatho Rusyn (61.1%, a difference of 0.42%), and Immigrants from Eastern Africa (61.1%, a difference of 0.54%).
| Demographics | Rating | Rank | Family Households |
| Immigrants | France | 0.0 /100 | #331 | Tragic 61.3% |
| Ethiopians | 0.0 /100 | #332 | Tragic 61.2% |
| Immigrants | Ethiopia | 0.0 /100 | #333 | Tragic 61.2% |
| Immigrants | Eastern Africa | 0.0 /100 | #334 | Tragic 61.1% |
| Carpatho Rusyns | 0.0 /100 | #335 | Tragic 61.1% |
| German Russians | 0.0 /100 | #336 | Tragic 60.9% |
| Soviet Union | 0.0 /100 | #337 | Tragic 60.9% |
| Immigrants | Eritrea | 0.0 /100 | #338 | Tragic 60.8% |
| Immigrants | Saudi Arabia | 0.0 /100 | #339 | Tragic 60.7% |
| Immigrants | Sudan | 0.0 /100 | #340 | Tragic 60.2% |
| Immigrants | Senegal | 0.0 /100 | #341 | Tragic 60.1% |
| Sudanese | 0.0 /100 | #342 | Tragic 60.0% |
| Senegalese | 0.0 /100 | #343 | Tragic 59.8% |
| Immigrants | Congo | 0.0 /100 | #344 | Tragic 59.2% |
| Immigrants | Zaire | 0.0 /100 | #345 | Tragic 59.2% |