Ottawa vs Immigrants from Eritrea Family Households
COMPARE
Ottawa
Immigrants from Eritrea
Family Households
Family Households Comparison
Ottawa
Immigrants from Eritrea
63.0%
FAMILY HOUSEHOLDS
0.3/ 100
METRIC RATING
277th/ 347
METRIC RANK
60.8%
FAMILY HOUSEHOLDS
0.0/ 100
METRIC RATING
338th/ 347
METRIC RANK
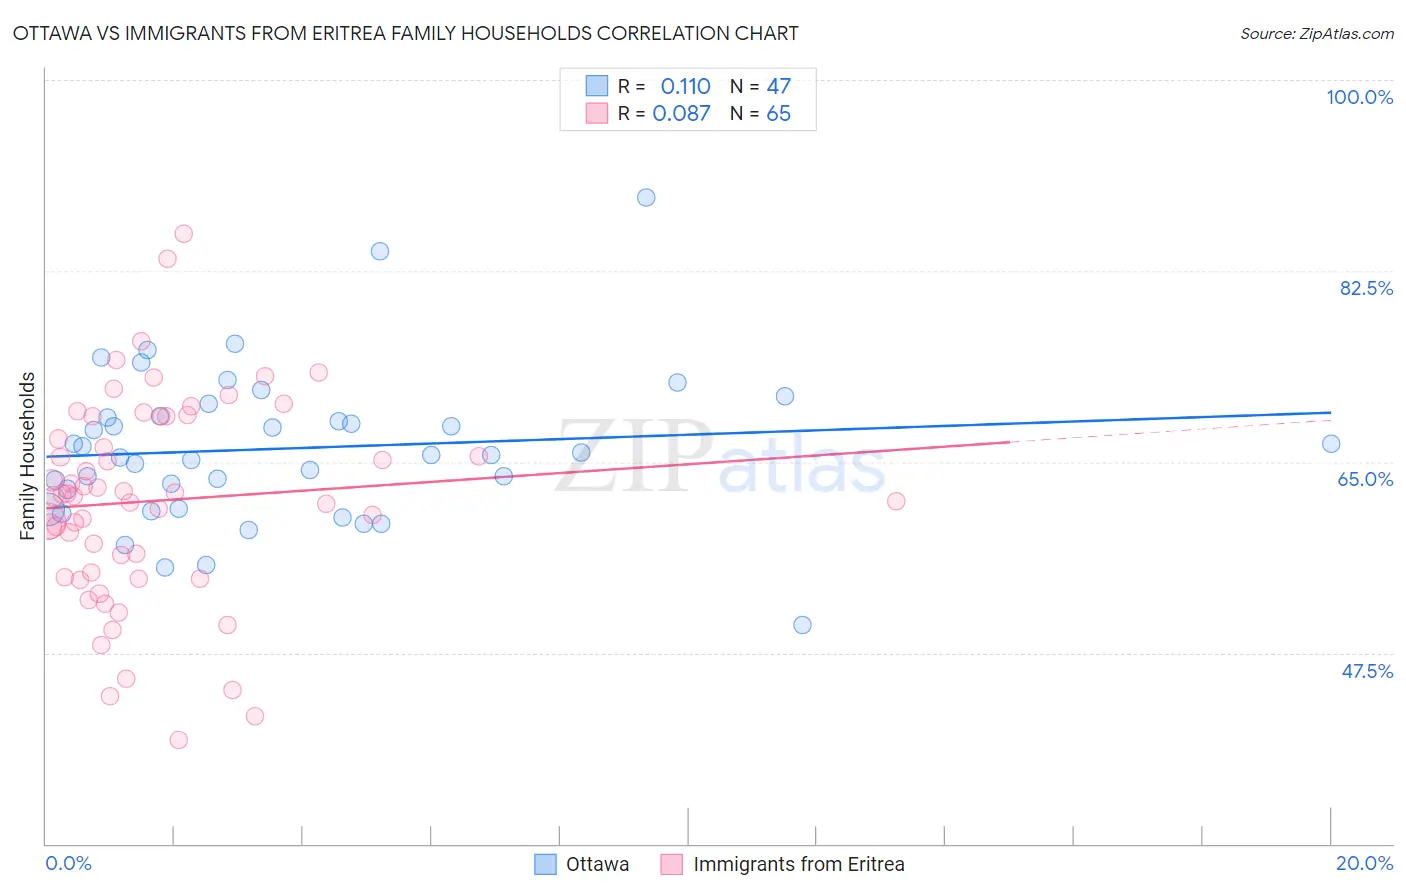
Ottawa vs Immigrants from Eritrea Family Households Correlation Chart
The statistical analysis conducted on geographies consisting of 49,944,420 people shows a poor positive correlation between the proportion of Ottawa and percentage of family households in the United States with a correlation coefficient (R) of 0.110 and weighted average of 63.0%. Similarly, the statistical analysis conducted on geographies consisting of 104,847,164 people shows a slight positive correlation between the proportion of Immigrants from Eritrea and percentage of family households in the United States with a correlation coefficient (R) of 0.087 and weighted average of 60.8%, a difference of 3.6%.
Family Households Correlation Summary
| Measurement | Ottawa | Immigrants from Eritrea |
| Minimum | 50.0% | 39.5% |
| Maximum | 89.2% | 85.9% |
| Range | 39.2% | 46.3% |
| Mean | 66.2% | 61.4% |
| Median | 65.7% | 61.9% |
| Interquartile 25% (IQ1) | 60.7% | 54.6% |
| Interquartile 75% (IQ3) | 69.2% | 69.2% |
| Interquartile Range (IQR) | 8.6% | 14.6% |
| Standard Deviation (Sample) | 7.1% | 9.4% |
| Standard Deviation (Population) | 7.0% | 9.3% |
Similar Demographics by Family Households
Demographics Similar to Ottawa by Family Households
In terms of family households, the demographic groups most similar to Ottawa are Immigrants from Belgium (63.0%, a difference of 0.040%), Serbian (63.0%, a difference of 0.050%), Lumbee (63.1%, a difference of 0.070%), West Indian (63.1%, a difference of 0.070%), and Immigrants from Kazakhstan (63.1%, a difference of 0.080%).
| Demographics | Rating | Rank | Family Households |
| Immigrants | Austria | 0.3 /100 | #270 | Tragic 63.1% |
| Immigrants | Croatia | 0.3 /100 | #271 | Tragic 63.1% |
| Immigrants | Turkey | 0.3 /100 | #272 | Tragic 63.1% |
| Immigrants | Kazakhstan | 0.3 /100 | #273 | Tragic 63.1% |
| Lumbee | 0.3 /100 | #274 | Tragic 63.1% |
| West Indians | 0.3 /100 | #275 | Tragic 63.1% |
| Serbians | 0.3 /100 | #276 | Tragic 63.0% |
| Ottawa | 0.3 /100 | #277 | Tragic 63.0% |
| Immigrants | Belgium | 0.2 /100 | #278 | Tragic 63.0% |
| Immigrants | Yemen | 0.2 /100 | #279 | Tragic 63.0% |
| Immigrants | Bulgaria | 0.2 /100 | #280 | Tragic 63.0% |
| Estonians | 0.2 /100 | #281 | Tragic 62.9% |
| New Zealanders | 0.1 /100 | #282 | Tragic 62.9% |
| Immigrants | Denmark | 0.1 /100 | #283 | Tragic 62.9% |
| Australians | 0.1 /100 | #284 | Tragic 62.8% |
Demographics Similar to Immigrants from Eritrea by Family Households
In terms of family households, the demographic groups most similar to Immigrants from Eritrea are German Russian (60.9%, a difference of 0.14%), Soviet Union (60.9%, a difference of 0.14%), Immigrants from Saudi Arabia (60.7%, a difference of 0.20%), Carpatho Rusyn (61.1%, a difference of 0.42%), and Immigrants from Eastern Africa (61.1%, a difference of 0.54%).
| Demographics | Rating | Rank | Family Households |
| Immigrants | France | 0.0 /100 | #331 | Tragic 61.3% |
| Ethiopians | 0.0 /100 | #332 | Tragic 61.2% |
| Immigrants | Ethiopia | 0.0 /100 | #333 | Tragic 61.2% |
| Immigrants | Eastern Africa | 0.0 /100 | #334 | Tragic 61.1% |
| Carpatho Rusyns | 0.0 /100 | #335 | Tragic 61.1% |
| German Russians | 0.0 /100 | #336 | Tragic 60.9% |
| Soviet Union | 0.0 /100 | #337 | Tragic 60.9% |
| Immigrants | Eritrea | 0.0 /100 | #338 | Tragic 60.8% |
| Immigrants | Saudi Arabia | 0.0 /100 | #339 | Tragic 60.7% |
| Immigrants | Sudan | 0.0 /100 | #340 | Tragic 60.2% |
| Immigrants | Senegal | 0.0 /100 | #341 | Tragic 60.1% |
| Sudanese | 0.0 /100 | #342 | Tragic 60.0% |
| Senegalese | 0.0 /100 | #343 | Tragic 59.8% |
| Immigrants | Congo | 0.0 /100 | #344 | Tragic 59.2% |
| Immigrants | Zaire | 0.0 /100 | #345 | Tragic 59.2% |