Dutch vs Immigrants from Caribbean Family Households

COMPARE

Dutch
Race
Ancestry
AfghanAfricanAlaska NativeAlaskan AthabascanAlbanianAleutAlsatianAmericanApacheArabArapahoArgentineanArmenianAssyrian/Chaldean/SyriacAustralianAustrianBahamianBangladeshiBarbadianBasqueBelgianBelizeanBermudanBhutaneseBlackfeetBolivianBrazilianBritishBritish West IndianBulgarianBurmeseCajunCambodianCanadianCape VerdeanCarpatho RusynCelticCentral AmericanCentral American IndianCherokeeCheyenneChickasawChileanChineseChippewaChoctawColombianColvilleComancheCosta RicanCreeCreekCroatianCrowCubanCypriotCzechCzechoslovakianDanishDelawareDominicanDutchDutch West IndianEastern EuropeanEcuadorianEgyptianEnglishEstonianEthiopianEuropeanFijianFilipinoFinnishFrenchFrench American IndianFrench CanadianGermanGerman RussianGhanaianGreekGuamanian/ChamorroGuatemalanGuyaneseHaitianHmongHonduranHopiHoumaHungarianIcelanderIndian (Asian)IndonesianInupiatIranianIraqiIrishIroquoisIsraeliItalianJamaicanJapaneseJordanianKenyanKiowaKoreanLaotianLatvianLebaneseLiberianLithuanianLumbeeLuxembourgerMacedonianMalaysianMalteseMarshalleseMenomineeMexicanMexican American IndianMongolianMoroccanNative HawaiianNavajoNepaleseNew ZealanderNicaraguanNigerianNorthern EuropeanNorwegianOkinawanOsageOttawaPaiutePakistaniPalestinianPanamanianParaguayanPennsylvania GermanPeruvianPimaPolishPortuguesePotawatomiPuebloPuerto RicanPuget Sound SalishRomanianRussianSalvadoranSamoanScandinavianScotch-IrishScottishSeminoleSenegaleseSerbianShoshoneSierra LeoneanSiouxSlavicSlovakSloveneSomaliSouth AfricanSouth AmericanSouth American IndianSoviet UnionSpaniardSpanishSpanish AmericanSpanish American IndianSri LankanSubsaharan AfricanSudaneseSwedishSwissSyrianTaiwaneseThaiTlingit-HaidaTohono O'OdhamTonganTrinidadian and TobagonianTsimshianTurkishU.S. Virgin IslanderUgandanUkrainianUruguayanUteVenezuelanVietnameseWelshWest IndianYakamaYaquiYugoslavianYumanYup'ikZimbabwean
Immigration
NonimmigrantsImmigrantsAfghanistanAfricaAlbaniaArgentinaArmeniaAsiaAustraliaAustriaBahamasBangladeshBarbadosBelarusBelgiumBelizeBoliviaBosnia and HerzegovinaBrazilBulgariaBurma/MyanmarCabo VerdeCambodiaCameroonCanadaCentral AmericaChileChinaColombiaCongoCosta RicaCroatiaCubaCzechoslovakiaDenmarkDominicaDominican RepublicEastern AfricaEastern AsiaEastern EuropeEcuadorEgyptEl SalvadorEnglandEritreaEthiopiaEuropeFijiFranceGermanyGhanaGreeceGrenadaGuatemalaGuyanaHaitiHondurasHong KongHungaryIndiaIndonesiaIranIraqIrelandIsraelItalyJamaicaJapanJordanKazakhstanKenyaKoreaKuwaitLaosLatin AmericaLatviaLebanonLiberiaLithuaniaMalaysiaMexicoMicronesiaMiddle AfricaMoldovaMoroccoNepalNetherlandsNicaraguaNigeriaNorth AmericaNorth MacedoniaNorthern AfricaNorthern EuropeNorwayOceaniaPakistanPanamaPeruPhilippinesPolandPortugalRomaniaRussiaSaudi ArabiaScotlandSenegalSerbiaSierra LeoneSingaporeSomaliaSouth AfricaSouth AmericaSouth Central AsiaSouth Eastern AsiaSouthern EuropeSpainSri LankaSt. Vincent and the GrenadinesSudanSwedenSwitzerlandSyriaTaiwanThailandTrinidad and TobagoTurkeyUgandaUkraineUruguayUzbekistanVenezuelaVietnamWest IndiesWestern AfricaWestern AsiaWestern EuropeYemenZaireZimbabweAzores
Immigrants from Caribbean
Race
Ancestry
AfghanAfricanAlaska NativeAlaskan AthabascanAlbanianAleutAlsatianAmericanApacheArabArapahoArgentineanArmenianAssyrian/Chaldean/SyriacAustralianAustrianBahamianBangladeshiBarbadianBasqueBelgianBelizeanBermudanBhutaneseBlackfeetBolivianBrazilianBritishBritish West IndianBulgarianBurmeseCajunCambodianCanadianCape VerdeanCarpatho RusynCelticCentral AmericanCentral American IndianCherokeeCheyenneChickasawChileanChineseChippewaChoctawColombianColvilleComancheCosta RicanCreeCreekCroatianCrowCubanCypriotCzechCzechoslovakianDanishDelawareDominicanDutch West IndianEastern EuropeanEcuadorianEgyptianEnglishEstonianEthiopianEuropeanFijianFilipinoFinnishFrenchFrench American IndianFrench CanadianGermanGerman RussianGhanaianGreekGuamanian/ChamorroGuatemalanGuyaneseHaitianHmongHonduranHopiHoumaHungarianIcelanderIndian (Asian)IndonesianInupiatIranianIraqiIrishIroquoisIsraeliItalianJamaicanJapaneseJordanianKenyanKiowaKoreanLaotianLatvianLebaneseLiberianLithuanianLumbeeLuxembourgerMacedonianMalaysianMalteseMarshalleseMenomineeMexicanMexican American IndianMongolianMoroccanNative HawaiianNavajoNepaleseNew ZealanderNicaraguanNigerianNorthern EuropeanNorwegianOkinawanOsageOttawaPaiutePakistaniPalestinianPanamanianParaguayanPennsylvania GermanPeruvianPimaPolishPortuguesePotawatomiPuebloPuerto RicanPuget Sound SalishRomanianRussianSalvadoranSamoanScandinavianScotch-IrishScottishSeminoleSenegaleseSerbianShoshoneSierra LeoneanSiouxSlavicSlovakSloveneSomaliSouth AfricanSouth AmericanSouth American IndianSoviet UnionSpaniardSpanishSpanish AmericanSpanish American IndianSri LankanSubsaharan AfricanSudaneseSwedishSwissSyrianTaiwaneseThaiTlingit-HaidaTohono O'OdhamTonganTrinidadian and TobagonianTsimshianTurkishU.S. Virgin IslanderUgandanUkrainianUruguayanUteVenezuelanVietnameseWelshWest IndianYakamaYaquiYugoslavianYumanYup'ikZimbabwean
Immigration
NonimmigrantsImmigrantsAfghanistanAfricaAlbaniaArgentinaArmeniaAsiaAustraliaAustriaBahamasBangladeshBarbadosBelarusBelgiumBelizeBoliviaBosnia and HerzegovinaBrazilBulgariaBurma/MyanmarCabo VerdeCambodiaCameroonCanadaCaribbeanCentral AmericaChileChinaColombiaCongoCosta RicaCroatiaCubaCzechoslovakiaDenmarkDominicaDominican RepublicEastern AfricaEastern AsiaEastern EuropeEcuadorEgyptEl SalvadorEnglandEritreaEthiopiaEuropeFijiFranceGermanyGhanaGreeceGrenadaGuatemalaGuyanaHaitiHondurasHong KongHungaryIndiaIndonesiaIranIraqIrelandIsraelItalyJamaicaJapanJordanKazakhstanKenyaKoreaKuwaitLaosLatin AmericaLatviaLebanonLiberiaLithuaniaMalaysiaMexicoMicronesiaMiddle AfricaMoldovaMoroccoNepalNetherlandsNicaraguaNigeriaNorth AmericaNorth MacedoniaNorthern AfricaNorthern EuropeNorwayOceaniaPakistanPanamaPeruPhilippinesPolandPortugalRomaniaRussiaSaudi ArabiaScotlandSenegalSerbiaSierra LeoneSingaporeSomaliaSouth AfricaSouth AmericaSouth Central AsiaSouth Eastern AsiaSouthern EuropeSpainSri LankaSt. Vincent and the GrenadinesSudanSwedenSwitzerlandSyriaTaiwanThailandTrinidad and TobagoTurkeyUgandaUkraineUruguayUzbekistanVenezuelaVietnamWest IndiesWestern AfricaWestern AsiaWestern EuropeYemenZaireZimbabweAzores
Family Households
Income
Poverty
Unemployment
Labor Participation
Family Structure
Vehicle Availability
Education Level
Disability

Family Households Comparison

Dutch

Immigrants from Caribbean

Exceptional
Exceptional
64.9%
FAMILY HOUSEHOLDS
95.1/ 100
METRIC RATING
118th/ 347
METRIC RANK
65.3%
FAMILY HOUSEHOLDS
99.1/ 100
METRIC RATING
89th/ 347
METRIC RANK

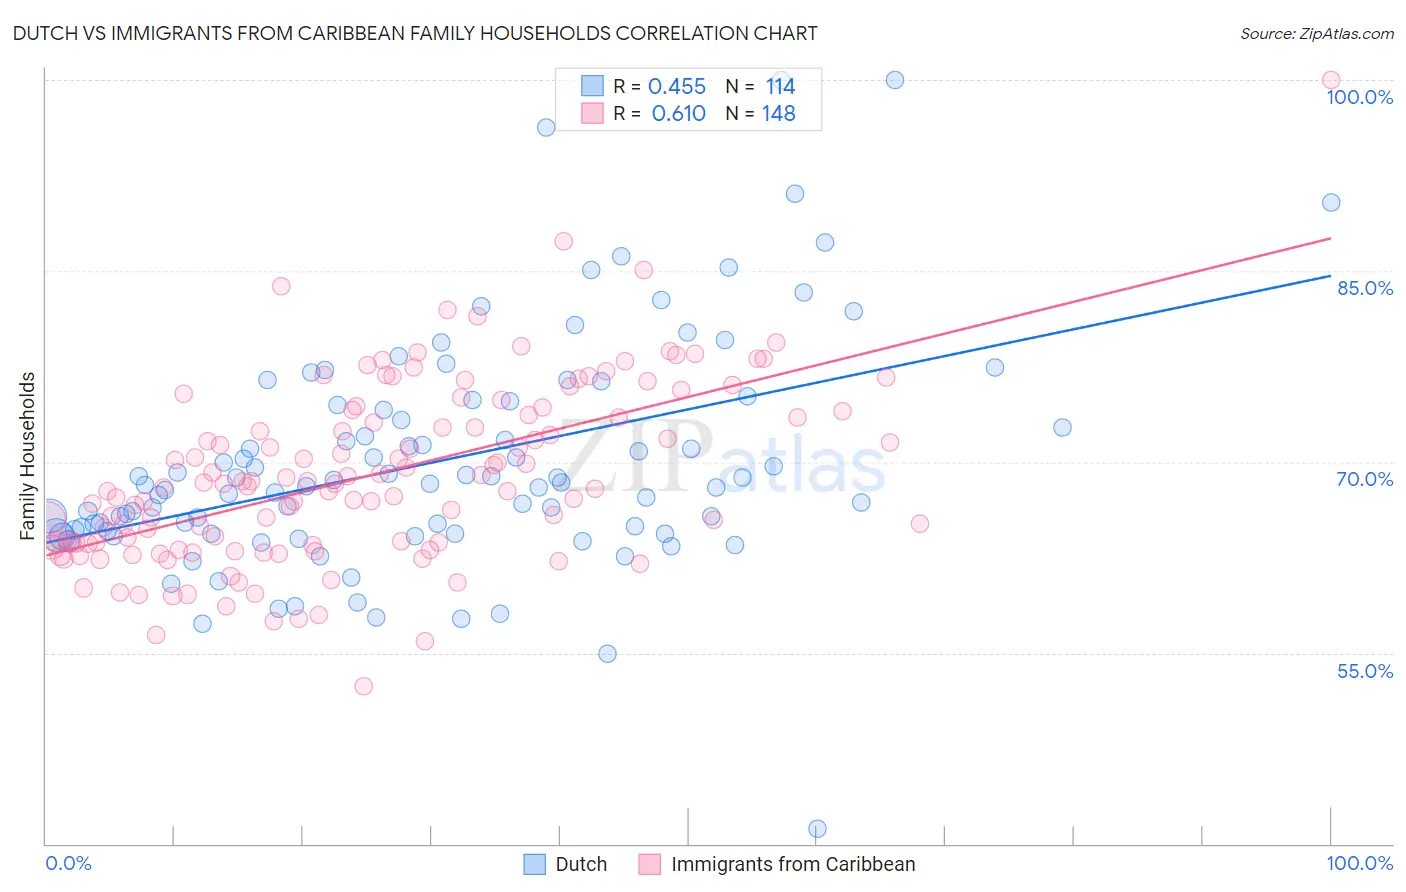
Dutch vs Immigrants from Caribbean Family Households Correlation Chart

The statistical analysis conducted on geographies consisting of 553,876,441 people shows a moderate positive correlation between the proportion of Dutch and percentage of family households in the United States with a correlation coefficient (R) of 0.455 and weighted average of 64.9%. Similarly, the statistical analysis conducted on geographies consisting of 449,694,372 people shows a significant positive correlation between the proportion of Immigrants from Caribbean and percentage of family households in the United States with a correlation coefficient (R) of 0.610 and weighted average of 65.3%, a difference of 0.58%.
Dutch vs Immigrants from Caribbean Family Households

Family Households Correlation Summary

MeasurementDutchImmigrants from Caribbean
Minimum41.2%52.4%
Maximum100.0%100.0%
Range58.8%47.6%
Mean70.0%68.9%
Median68.2%68.2%
Interquartile 25% (IQ1)64.5%63.6%
Interquartile 75% (IQ3)74.5%73.8%
Interquartile Range (IQR)9.9%10.2%
Standard Deviation (Sample)9.1%7.1%
Standard Deviation (Population)9.1%7.1%

Similar Demographics by Family Households

Demographics Similar to Dutch by Family Households

In terms of family households, the demographic groups most similar to Dutch are Ecuadorian (65.0%, a difference of 0.020%), Immigrants from Iraq (65.0%, a difference of 0.020%), Cherokee (65.0%, a difference of 0.020%), Immigrants from Eastern Asia (64.9%, a difference of 0.040%), and Argentinean (65.0%, a difference of 0.050%).
DemographicsRating | RankFamily Households
Europeans
96.8
/100
|
#111
Exceptional
65.0%
Immigrants | Jordan
96.5
/100
|
#112
Exceptional
65.0%
Spanish
96.2
/100
|
#113
Exceptional
65.0%
Argentineans
95.7
/100
|
#114
Exceptional
65.0%
Ecuadorians
95.4
/100
|
#115
Exceptional
65.0%
Immigrants | Iraq
95.4
/100
|
#116
Exceptional
65.0%
Cherokee
95.3
/100
|
#117
Exceptional
65.0%
Dutch
95.1
/100
|
#118
Exceptional
64.9%
Immigrants | Eastern Asia
94.4
/100
|
#119
Exceptional
64.9%
Immigrants | Oceania
94.2
/100
|
#120
Exceptional
64.9%
Hungarians
94.0
/100
|
#121
Exceptional
64.9%
Hmong
93.4
/100
|
#122
Exceptional
64.9%
Choctaw
93.4
/100
|
#123
Exceptional
64.9%
Immigrants | Argentina
92.8
/100
|
#124
Exceptional
64.9%
Immigrants | Belize
92.7
/100
|
#125
Exceptional
64.9%

Demographics Similar to Immigrants from Caribbean by Family Households

In terms of family households, the demographic groups most similar to Immigrants from Caribbean are Immigrants from Haiti (65.3%, a difference of 0.010%), Immigrants from Laos (65.3%, a difference of 0.010%), Immigrants from Egypt (65.3%, a difference of 0.040%), Crow (65.3%, a difference of 0.060%), and Hopi (65.3%, a difference of 0.10%).
DemographicsRating | RankFamily Households
Immigrants | Lebanon
99.7
/100
|
#82
Exceptional
65.5%
Immigrants | Guyana
99.6
/100
|
#83
Exceptional
65.5%
Americans
99.6
/100
|
#84
Exceptional
65.5%
Immigrants | Cambodia
99.5
/100
|
#85
Exceptional
65.4%
Egyptians
99.4
/100
|
#86
Exceptional
65.4%
Immigrants | Egypt
99.2
/100
|
#87
Exceptional
65.3%
Immigrants | Haiti
99.1
/100
|
#88
Exceptional
65.3%
Immigrants | Caribbean
99.1
/100
|
#89
Exceptional
65.3%
Immigrants | Laos
99.1
/100
|
#90
Exceptional
65.3%
Crow
98.9
/100
|
#91
Exceptional
65.3%
Hopi
98.8
/100
|
#92
Exceptional
65.3%
Guyanese
98.8
/100
|
#93
Exceptional
65.3%
Immigrants | Poland
98.7
/100
|
#94
Exceptional
65.2%
Immigrants | Portugal
98.6
/100
|
#95
Exceptional
65.2%
Swiss
98.6
/100
|
#96
Exceptional
65.2%