Immigrants from Romania vs Immigrants from Eritrea Family Households
COMPARE
Immigrants from Romania
Immigrants from Eritrea
Family Households
Family Households Comparison
Immigrants from Romania
Immigrants from Eritrea
64.6%
FAMILY HOUSEHOLDS
77.0/ 100
METRIC RATING
146th/ 347
METRIC RANK
60.8%
FAMILY HOUSEHOLDS
0.0/ 100
METRIC RATING
338th/ 347
METRIC RANK
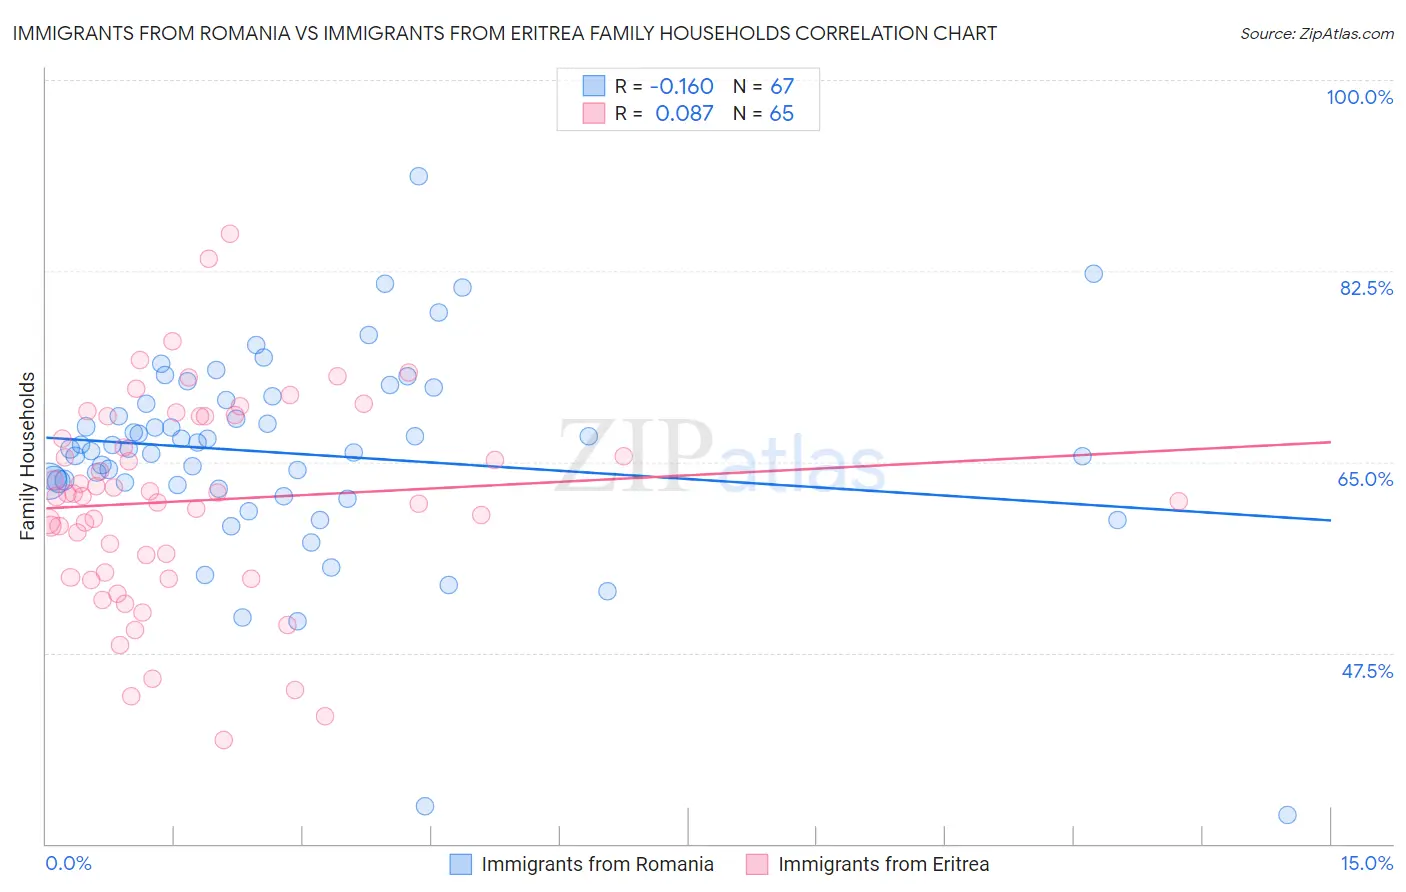
Immigrants from Romania vs Immigrants from Eritrea Family Households Correlation Chart
The statistical analysis conducted on geographies consisting of 256,963,245 people shows a poor negative correlation between the proportion of Immigrants from Romania and percentage of family households in the United States with a correlation coefficient (R) of -0.160 and weighted average of 64.6%. Similarly, the statistical analysis conducted on geographies consisting of 104,847,164 people shows a slight positive correlation between the proportion of Immigrants from Eritrea and percentage of family households in the United States with a correlation coefficient (R) of 0.087 and weighted average of 60.8%, a difference of 6.1%.
Family Households Correlation Summary
| Measurement | Immigrants from Romania | Immigrants from Eritrea |
| Minimum | 32.6% | 39.5% |
| Maximum | 91.2% | 85.9% |
| Range | 58.6% | 46.3% |
| Mean | 65.8% | 61.4% |
| Median | 66.2% | 61.9% |
| Interquartile 25% (IQ1) | 62.9% | 54.6% |
| Interquartile 75% (IQ3) | 70.7% | 69.2% |
| Interquartile Range (IQR) | 7.8% | 14.6% |
| Standard Deviation (Sample) | 9.4% | 9.4% |
| Standard Deviation (Population) | 9.3% | 9.3% |
Similar Demographics by Family Households
Demographics Similar to Immigrants from Romania by Family Households
In terms of family households, the demographic groups most similar to Immigrants from Romania are Immigrants from Chile (64.6%, a difference of 0.010%), Delaware (64.6%, a difference of 0.010%), Sioux (64.6%, a difference of 0.010%), Romanian (64.5%, a difference of 0.030%), and Syrian (64.5%, a difference of 0.030%).
| Demographics | Rating | Rank | Family Households |
| Immigrants | Jamaica | 85.3 /100 | #139 | Excellent 64.7% |
| Immigrants | North Macedonia | 84.9 /100 | #140 | Excellent 64.7% |
| Immigrants | Cameroon | 84.8 /100 | #141 | Excellent 64.7% |
| Pakistanis | 84.0 /100 | #142 | Excellent 64.7% |
| Czechoslovakians | 82.1 /100 | #143 | Excellent 64.6% |
| South American Indians | 81.9 /100 | #144 | Excellent 64.6% |
| Welsh | 80.1 /100 | #145 | Excellent 64.6% |
| Immigrants | Romania | 77.0 /100 | #146 | Good 64.6% |
| Immigrants | Chile | 76.5 /100 | #147 | Good 64.6% |
| Delaware | 76.3 /100 | #148 | Good 64.6% |
| Sioux | 76.3 /100 | #149 | Good 64.6% |
| Romanians | 75.3 /100 | #150 | Good 64.5% |
| Syrians | 75.2 /100 | #151 | Good 64.5% |
| Scottish | 70.9 /100 | #152 | Good 64.5% |
| Swedes | 69.8 /100 | #153 | Good 64.5% |
Demographics Similar to Immigrants from Eritrea by Family Households
In terms of family households, the demographic groups most similar to Immigrants from Eritrea are German Russian (60.9%, a difference of 0.14%), Soviet Union (60.9%, a difference of 0.14%), Immigrants from Saudi Arabia (60.7%, a difference of 0.20%), Carpatho Rusyn (61.1%, a difference of 0.42%), and Immigrants from Eastern Africa (61.1%, a difference of 0.54%).
| Demographics | Rating | Rank | Family Households |
| Immigrants | France | 0.0 /100 | #331 | Tragic 61.3% |
| Ethiopians | 0.0 /100 | #332 | Tragic 61.2% |
| Immigrants | Ethiopia | 0.0 /100 | #333 | Tragic 61.2% |
| Immigrants | Eastern Africa | 0.0 /100 | #334 | Tragic 61.1% |
| Carpatho Rusyns | 0.0 /100 | #335 | Tragic 61.1% |
| German Russians | 0.0 /100 | #336 | Tragic 60.9% |
| Soviet Union | 0.0 /100 | #337 | Tragic 60.9% |
| Immigrants | Eritrea | 0.0 /100 | #338 | Tragic 60.8% |
| Immigrants | Saudi Arabia | 0.0 /100 | #339 | Tragic 60.7% |
| Immigrants | Sudan | 0.0 /100 | #340 | Tragic 60.2% |
| Immigrants | Senegal | 0.0 /100 | #341 | Tragic 60.1% |
| Sudanese | 0.0 /100 | #342 | Tragic 60.0% |
| Senegalese | 0.0 /100 | #343 | Tragic 59.8% |
| Immigrants | Congo | 0.0 /100 | #344 | Tragic 59.2% |
| Immigrants | Zaire | 0.0 /100 | #345 | Tragic 59.2% |