Finnish vs Arapaho Average Family Size
COMPARE
Finnish
Arapaho
Average Family Size
Average Family Size Comparison
Finns
Arapaho
3.09
AVERAGE FAMILY SIZE
0.0/ 100
METRIC RATING
340th/ 347
METRIC RANK
3.64
AVERAGE FAMILY SIZE
100.0/ 100
METRIC RATING
6th/ 347
METRIC RANK
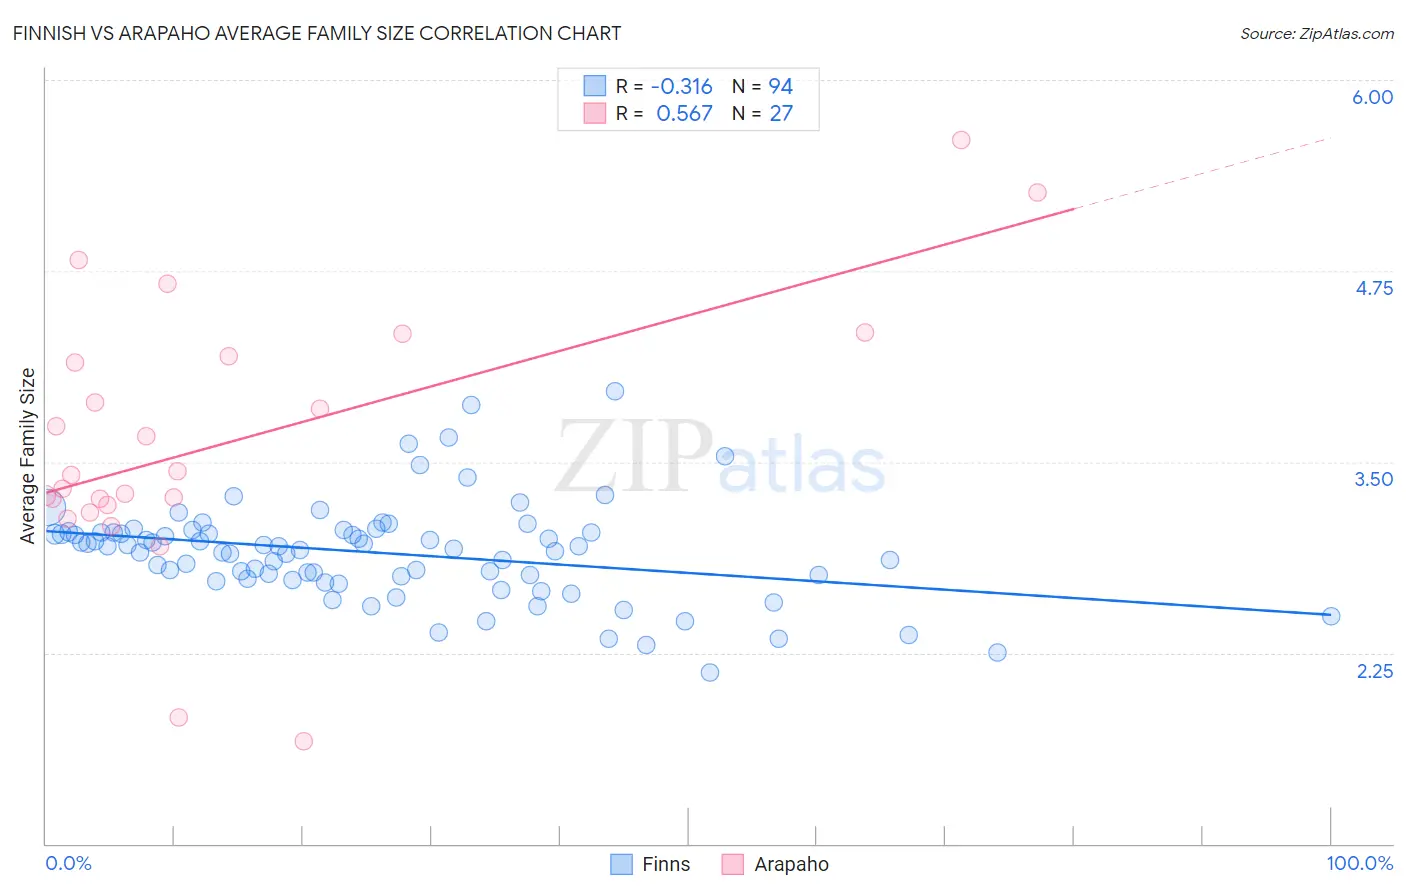
Finnish vs Arapaho Average Family Size Correlation Chart
The statistical analysis conducted on geographies consisting of 404,508,275 people shows a mild negative correlation between the proportion of Finns and average family size in the United States with a correlation coefficient (R) of -0.316 and weighted average of 3.09. Similarly, the statistical analysis conducted on geographies consisting of 29,778,233 people shows a substantial positive correlation between the proportion of Arapaho and average family size in the United States with a correlation coefficient (R) of 0.567 and weighted average of 3.64, a difference of 17.5%.
Average Family Size Correlation Summary
| Measurement | Finnish | Arapaho |
| Minimum | 2.12 | 1.67 |
| Maximum | 3.96 | 5.61 |
| Range | 1.84 | 3.94 |
| Mean | 2.90 | 3.63 |
| Median | 2.94 | 3.42 |
| Interquartile 25% (IQ1) | 2.74 | 3.22 |
| Interquartile 75% (IQ3) | 3.04 | 4.19 |
| Interquartile Range (IQR) | 0.30 | 0.97 |
| Standard Deviation (Sample) | 0.32 | 0.88 |
| Standard Deviation (Population) | 0.32 | 0.86 |
Similar Demographics by Average Family Size
Demographics Similar to Finns by Average Family Size
In terms of average family size, the demographic groups most similar to Finns are Polish (3.09, a difference of 0.050%), Croatian (3.10, a difference of 0.14%), French (3.10, a difference of 0.16%), Swedish (3.10, a difference of 0.18%), and German (3.09, a difference of 0.19%).
| Demographics | Rating | Rank | Average Family Size |
| Estonians | 0.0 /100 | #333 | Tragic 3.10 |
| Lithuanians | 0.0 /100 | #334 | Tragic 3.10 |
| Luxembourgers | 0.0 /100 | #335 | Tragic 3.10 |
| Irish | 0.0 /100 | #336 | Tragic 3.10 |
| Swedes | 0.0 /100 | #337 | Tragic 3.10 |
| French | 0.0 /100 | #338 | Tragic 3.10 |
| Croatians | 0.0 /100 | #339 | Tragic 3.10 |
| Finns | 0.0 /100 | #340 | Tragic 3.09 |
| Poles | 0.0 /100 | #341 | Tragic 3.09 |
| Germans | 0.0 /100 | #342 | Tragic 3.09 |
| Norwegians | 0.0 /100 | #343 | Tragic 3.08 |
| French Canadians | 0.0 /100 | #344 | Tragic 3.07 |
| Slovenes | 0.0 /100 | #345 | Tragic 3.07 |
| Slovaks | 0.0 /100 | #346 | Tragic 3.06 |
| Carpatho Rusyns | 0.0 /100 | #347 | Tragic 3.06 |
Demographics Similar to Arapaho by Average Family Size
In terms of average family size, the demographic groups most similar to Arapaho are Inupiat (3.63, a difference of 0.22%), Navajo (3.65, a difference of 0.27%), Immigrants from Yemen (3.60, a difference of 1.1%), Hopi (3.60, a difference of 1.1%), and Spanish American Indian (3.58, a difference of 1.4%).
| Demographics | Rating | Rank | Average Family Size |
| Yup'ik | 100 /100 | #1 | Exceptional 4.00 |
| Crow | 100 /100 | #2 | Exceptional 3.82 |
| Pueblo | 100 /100 | #3 | Exceptional 3.79 |
| Pima | 100 /100 | #4 | Exceptional 3.75 |
| Navajo | 100.0 /100 | #5 | Exceptional 3.65 |
| Arapaho | 100.0 /100 | #6 | Exceptional 3.64 |
| Inupiat | 100.0 /100 | #7 | Exceptional 3.63 |
| Immigrants | Yemen | 100.0 /100 | #8 | Exceptional 3.60 |
| Hopi | 100.0 /100 | #9 | Exceptional 3.60 |
| Spanish American Indians | 100.0 /100 | #10 | Exceptional 3.58 |
| Tohono O'odham | 100.0 /100 | #11 | Exceptional 3.53 |
| Immigrants | Mexico | 100.0 /100 | #12 | Exceptional 3.52 |
| Sioux | 100.0 /100 | #13 | Exceptional 3.52 |
| Immigrants | Central America | 100.0 /100 | #14 | Exceptional 3.49 |
| Tongans | 100.0 /100 | #15 | Exceptional 3.49 |