Immigrants from Chile vs Arapaho Average Family Size
COMPARE
Immigrants from Chile
Arapaho
Average Family Size
Average Family Size Comparison
Immigrants from Chile
Arapaho
3.24
AVERAGE FAMILY SIZE
63.2/ 100
METRIC RATING
161st/ 347
METRIC RANK
3.64
AVERAGE FAMILY SIZE
100.0/ 100
METRIC RATING
6th/ 347
METRIC RANK
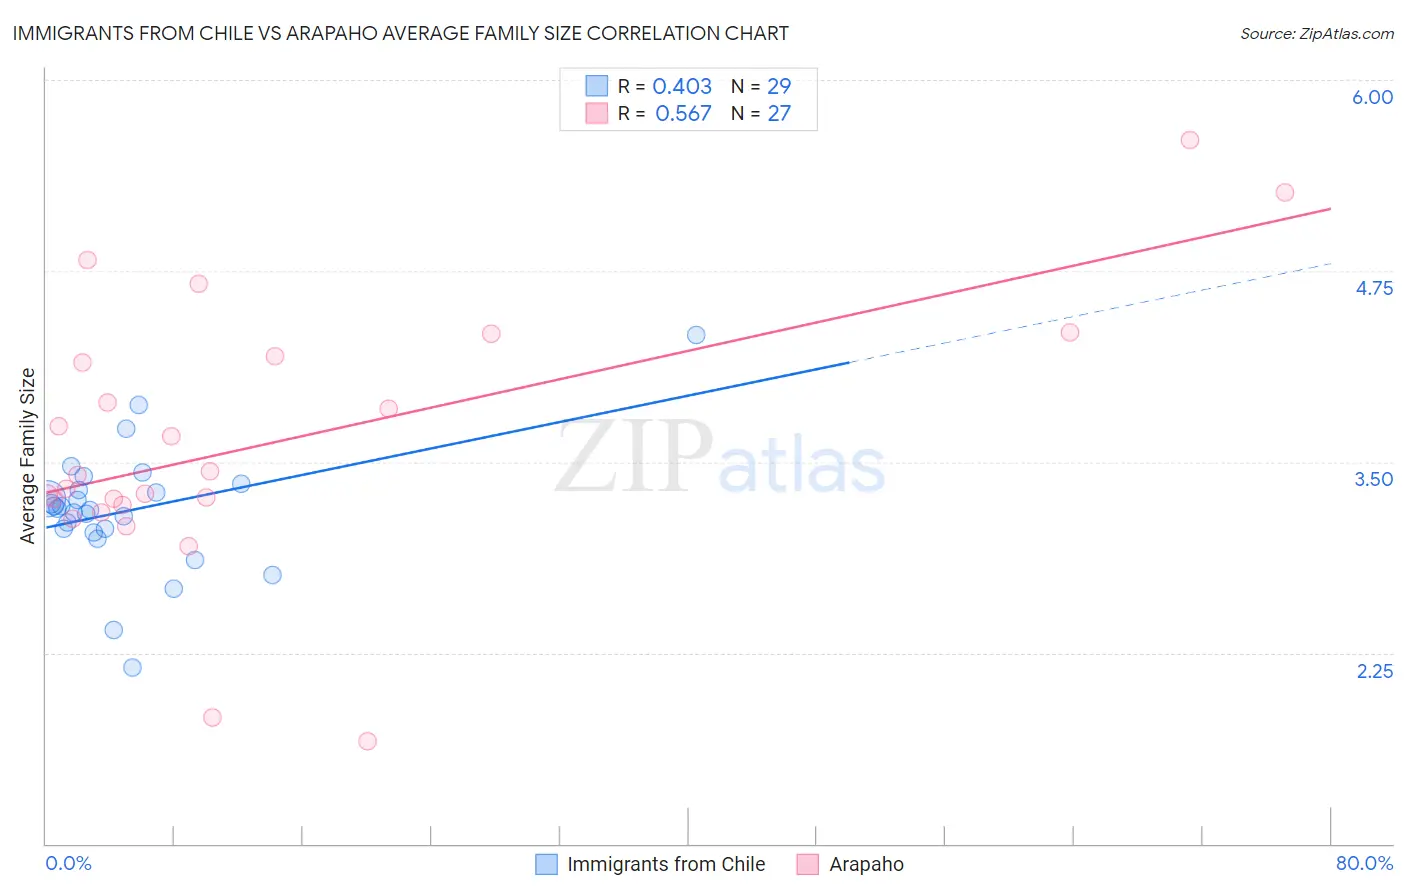
Immigrants from Chile vs Arapaho Average Family Size Correlation Chart
The statistical analysis conducted on geographies consisting of 218,601,267 people shows a moderate positive correlation between the proportion of Immigrants from Chile and average family size in the United States with a correlation coefficient (R) of 0.403 and weighted average of 3.24. Similarly, the statistical analysis conducted on geographies consisting of 29,778,233 people shows a substantial positive correlation between the proportion of Arapaho and average family size in the United States with a correlation coefficient (R) of 0.567 and weighted average of 3.64, a difference of 12.3%.
Average Family Size Correlation Summary
| Measurement | Immigrants from Chile | Arapaho |
| Minimum | 2.15 | 1.67 |
| Maximum | 4.33 | 5.61 |
| Range | 2.18 | 3.94 |
| Mean | 3.18 | 3.63 |
| Median | 3.19 | 3.42 |
| Interquartile 25% (IQ1) | 3.05 | 3.22 |
| Interquartile 75% (IQ3) | 3.34 | 4.19 |
| Interquartile Range (IQR) | 0.29 | 0.97 |
| Standard Deviation (Sample) | 0.41 | 0.88 |
| Standard Deviation (Population) | 0.40 | 0.86 |
Similar Demographics by Average Family Size
Demographics Similar to Immigrants from Chile by Average Family Size
In terms of average family size, the demographic groups most similar to Immigrants from Chile are Ethiopian (3.24, a difference of 0.010%), Immigrants from Iraq (3.24, a difference of 0.010%), Iraqi (3.24, a difference of 0.020%), Immigrants from Uganda (3.23, a difference of 0.060%), and Immigrants from Uzbekistan (3.24, a difference of 0.080%).
| Demographics | Rating | Rank | Average Family Size |
| Immigrants | Egypt | 70.0 /100 | #154 | Good 3.24 |
| Seminole | 68.2 /100 | #155 | Good 3.24 |
| Immigrants | Taiwan | 68.1 /100 | #156 | Good 3.24 |
| Immigrants | Uzbekistan | 67.0 /100 | #157 | Good 3.24 |
| Iraqis | 64.3 /100 | #158 | Good 3.24 |
| Ethiopians | 63.9 /100 | #159 | Good 3.24 |
| Immigrants | Iraq | 63.7 /100 | #160 | Good 3.24 |
| Immigrants | Chile | 63.2 /100 | #161 | Good 3.24 |
| Immigrants | Uganda | 60.1 /100 | #162 | Good 3.23 |
| Uruguayans | 58.8 /100 | #163 | Average 3.23 |
| Egyptians | 58.6 /100 | #164 | Average 3.23 |
| Ugandans | 58.4 /100 | #165 | Average 3.23 |
| Immigrants | Senegal | 57.5 /100 | #166 | Average 3.23 |
| Dutch West Indians | 56.9 /100 | #167 | Average 3.23 |
| Taiwanese | 54.2 /100 | #168 | Average 3.23 |
Demographics Similar to Arapaho by Average Family Size
In terms of average family size, the demographic groups most similar to Arapaho are Inupiat (3.63, a difference of 0.22%), Navajo (3.65, a difference of 0.27%), Immigrants from Yemen (3.60, a difference of 1.1%), Hopi (3.60, a difference of 1.1%), and Spanish American Indian (3.58, a difference of 1.4%).
| Demographics | Rating | Rank | Average Family Size |
| Yup'ik | 100 /100 | #1 | Exceptional 4.00 |
| Crow | 100 /100 | #2 | Exceptional 3.82 |
| Pueblo | 100 /100 | #3 | Exceptional 3.79 |
| Pima | 100 /100 | #4 | Exceptional 3.75 |
| Navajo | 100.0 /100 | #5 | Exceptional 3.65 |
| Arapaho | 100.0 /100 | #6 | Exceptional 3.64 |
| Inupiat | 100.0 /100 | #7 | Exceptional 3.63 |
| Immigrants | Yemen | 100.0 /100 | #8 | Exceptional 3.60 |
| Hopi | 100.0 /100 | #9 | Exceptional 3.60 |
| Spanish American Indians | 100.0 /100 | #10 | Exceptional 3.58 |
| Tohono O'odham | 100.0 /100 | #11 | Exceptional 3.53 |
| Immigrants | Mexico | 100.0 /100 | #12 | Exceptional 3.52 |
| Sioux | 100.0 /100 | #13 | Exceptional 3.52 |
| Immigrants | Central America | 100.0 /100 | #14 | Exceptional 3.49 |
| Tongans | 100.0 /100 | #15 | Exceptional 3.49 |