Delaware vs Arapaho Householder Income Over 65 years
COMPARE
Delaware
Arapaho
Householder Income Over 65 years
Householder Income Over 65 years Comparison
Delaware
Arapaho
$58,214
HOUSEHOLDER INCOME OVER 65 YEARS
5.3/ 100
METRIC RATING
222nd/ 347
METRIC RANK
$59,383
HOUSEHOLDER INCOME OVER 65 YEARS
16.0/ 100
METRIC RATING
204th/ 347
METRIC RANK
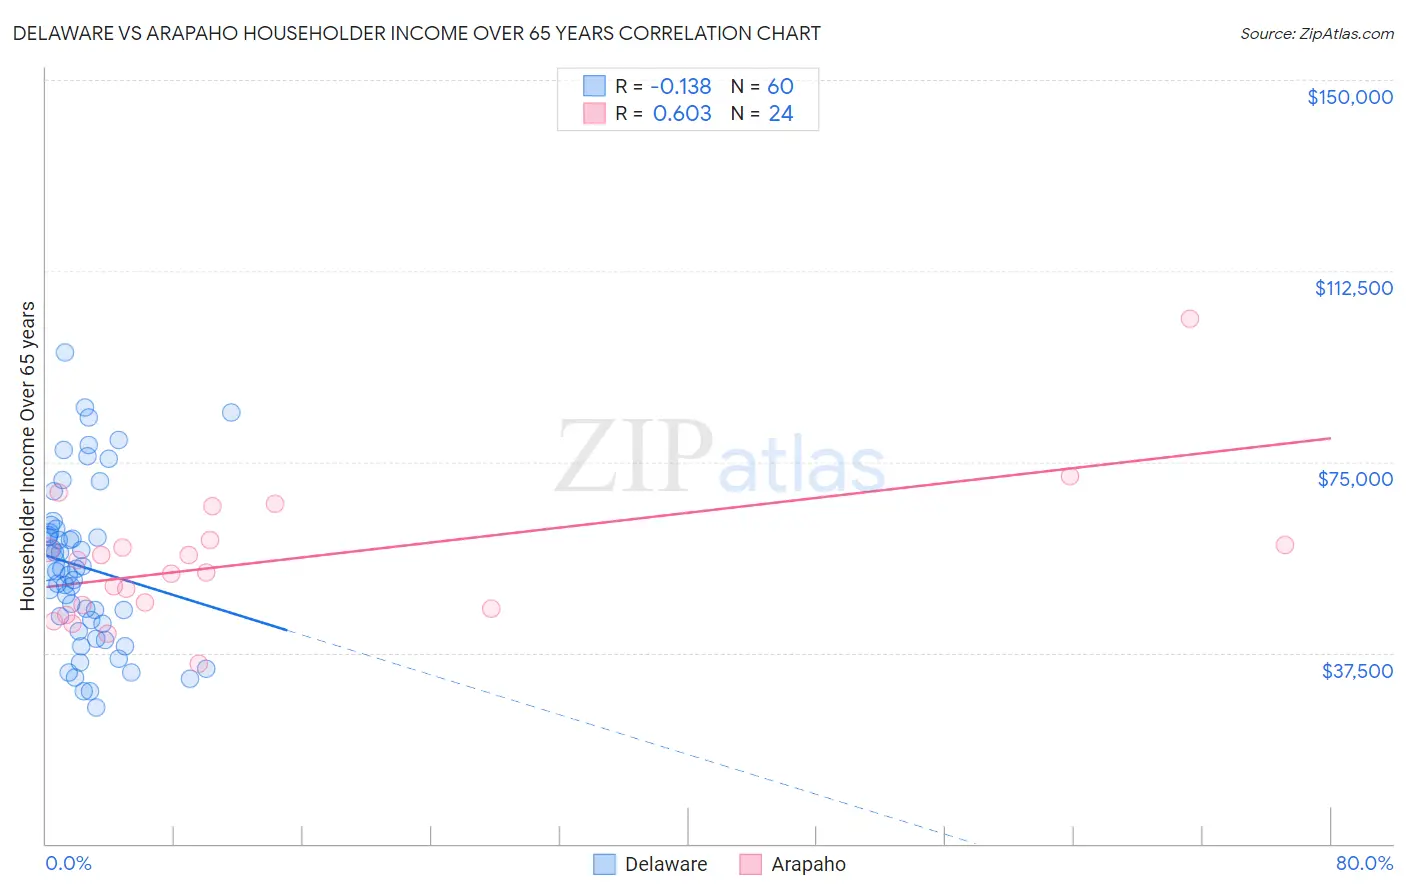
Delaware vs Arapaho Householder Income Over 65 years Correlation Chart
The statistical analysis conducted on geographies consisting of 96,156,233 people shows a poor negative correlation between the proportion of Delaware and household income with householder over the age of 65 in the United States with a correlation coefficient (R) of -0.138 and weighted average of $58,214. Similarly, the statistical analysis conducted on geographies consisting of 29,739,180 people shows a significant positive correlation between the proportion of Arapaho and household income with householder over the age of 65 in the United States with a correlation coefficient (R) of 0.603 and weighted average of $59,383, a difference of 2.0%.
Householder Income Over 65 years Correlation Summary
| Measurement | Delaware | Arapaho |
| Minimum | $26,761 | $35,366 |
| Maximum | $96,428 | $103,036 |
| Range | $69,667 | $67,670 |
| Mean | $54,295 | $55,690 |
| Median | $53,817 | $54,436 |
| Interquartile 25% (IQ1) | $42,460 | $46,442 |
| Interquartile 75% (IQ3) | $61,428 | $59,194 |
| Interquartile Range (IQR) | $18,968 | $12,751 |
| Standard Deviation (Sample) | $15,959 | $13,684 |
| Standard Deviation (Population) | $15,825 | $13,396 |
Demographics Similar to Delaware and Arapaho by Householder Income Over 65 years
In terms of householder income over 65 years, the demographic groups most similar to Delaware are Immigrants from El Salvador ($58,226, a difference of 0.020%), Tsimshian ($58,202, a difference of 0.020%), Malaysian ($58,244, a difference of 0.050%), Yugoslavian ($58,243, a difference of 0.050%), and Panamanian ($58,266, a difference of 0.090%). Similarly, the demographic groups most similar to Arapaho are Scotch-Irish ($59,447, a difference of 0.11%), Immigrants from Sudan ($59,248, a difference of 0.23%), Immigrants from South America ($59,151, a difference of 0.39%), Salvadoran ($59,141, a difference of 0.41%), and Uruguayan ($59,090, a difference of 0.50%).
| Demographics | Rating | Rank | Householder Income Over 65 years |
| Scotch-Irish | 16.9 /100 | #203 | Poor $59,447 |
| Arapaho | 16.0 /100 | #204 | Poor $59,383 |
| Immigrants | Sudan | 14.2 /100 | #205 | Poor $59,248 |
| Immigrants | South America | 13.0 /100 | #206 | Poor $59,151 |
| Salvadorans | 12.9 /100 | #207 | Poor $59,141 |
| Uruguayans | 12.3 /100 | #208 | Poor $59,090 |
| Slovaks | 11.7 /100 | #209 | Poor $59,039 |
| Nigerians | 11.2 /100 | #210 | Poor $58,992 |
| Immigrants | Nigeria | 10.7 /100 | #211 | Poor $58,942 |
| Colombians | 9.8 /100 | #212 | Tragic $58,851 |
| Whites/Caucasians | 9.8 /100 | #213 | Tragic $58,847 |
| Nepalese | 9.0 /100 | #214 | Tragic $58,761 |
| Immigrants | Ghana | 7.9 /100 | #215 | Tragic $58,624 |
| Immigrants | Middle Africa | 6.2 /100 | #216 | Tragic $58,375 |
| Sudanese | 5.7 /100 | #217 | Tragic $58,281 |
| Panamanians | 5.6 /100 | #218 | Tragic $58,266 |
| Malaysians | 5.5 /100 | #219 | Tragic $58,244 |
| Yugoslavians | 5.5 /100 | #220 | Tragic $58,243 |
| Immigrants | El Salvador | 5.4 /100 | #221 | Tragic $58,226 |
| Delaware | 5.3 /100 | #222 | Tragic $58,214 |
| Tsimshian | 5.2 /100 | #223 | Tragic $58,202 |