Czech vs Seminole Average Family Size
COMPARE
Czech
Seminole
Average Family Size
Average Family Size Comparison
Czechs
Seminole
3.11
AVERAGE FAMILY SIZE
0.0/ 100
METRIC RATING
328th/ 347
METRIC RANK
3.24
AVERAGE FAMILY SIZE
68.2/ 100
METRIC RATING
155th/ 347
METRIC RANK
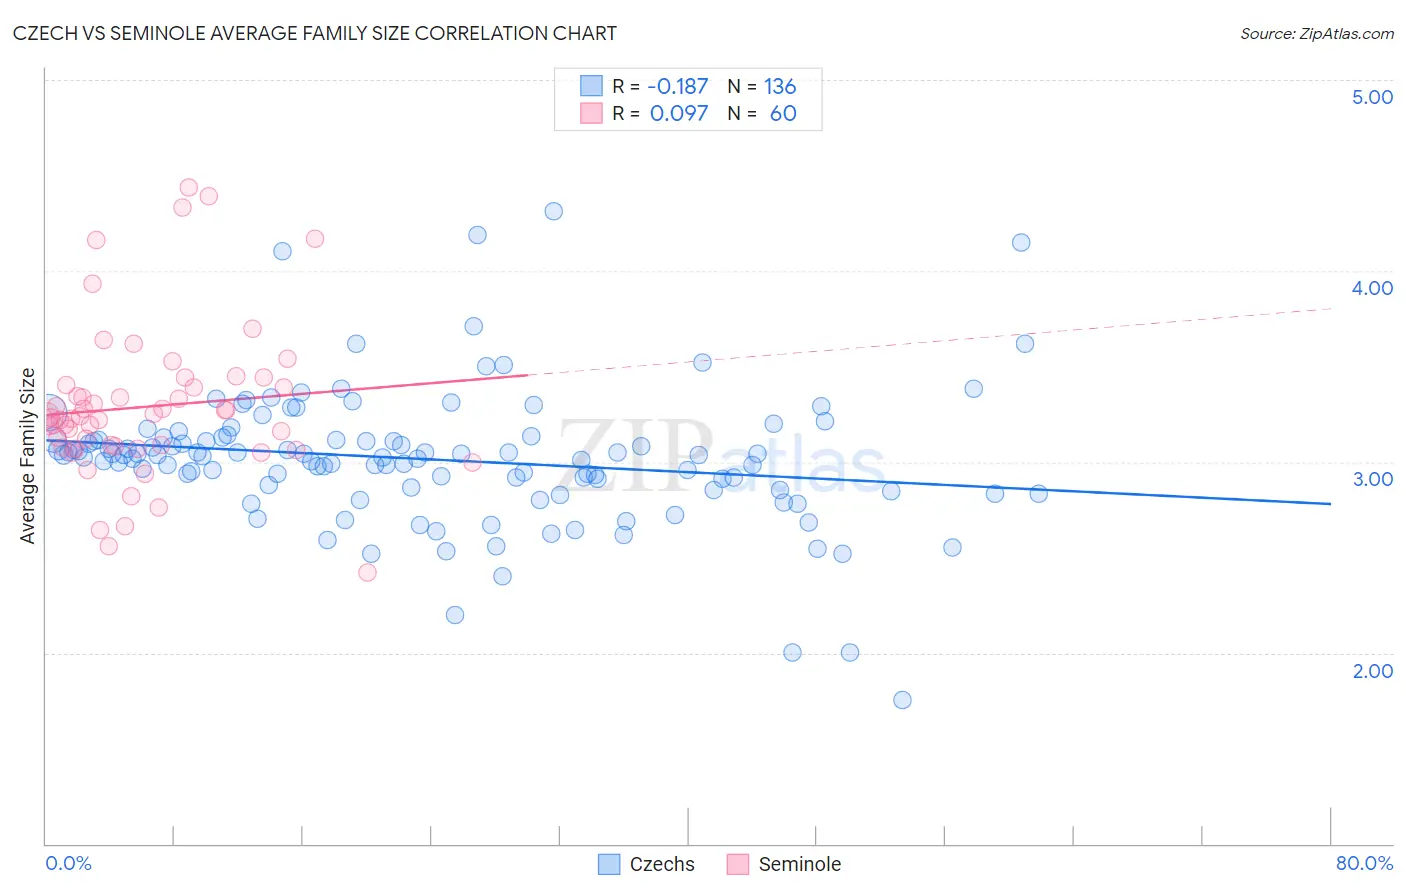
Czech vs Seminole Average Family Size Correlation Chart
The statistical analysis conducted on geographies consisting of 484,474,906 people shows a poor negative correlation between the proportion of Czechs and average family size in the United States with a correlation coefficient (R) of -0.187 and weighted average of 3.11. Similarly, the statistical analysis conducted on geographies consisting of 118,298,481 people shows a slight positive correlation between the proportion of Seminole and average family size in the United States with a correlation coefficient (R) of 0.097 and weighted average of 3.24, a difference of 4.2%.
Average Family Size Correlation Summary
| Measurement | Czech | Seminole |
| Minimum | 1.75 | 2.42 |
| Maximum | 4.31 | 4.44 |
| Range | 2.56 | 2.02 |
| Mean | 3.01 | 3.29 |
| Median | 3.03 | 3.24 |
| Interquartile 25% (IQ1) | 2.86 | 3.08 |
| Interquartile 75% (IQ3) | 3.12 | 3.40 |
| Interquartile Range (IQR) | 0.26 | 0.32 |
| Standard Deviation (Sample) | 0.36 | 0.41 |
| Standard Deviation (Population) | 0.36 | 0.40 |
Similar Demographics by Average Family Size
Demographics Similar to Czechs by Average Family Size
In terms of average family size, the demographic groups most similar to Czechs are Dutch (3.11, a difference of 0.0%), Ottawa (3.11, a difference of 0.010%), English (3.11, a difference of 0.060%), Belgian (3.11, a difference of 0.060%), and Celtic (3.11, a difference of 0.10%).
| Demographics | Rating | Rank | Average Family Size |
| Immigrants | Austria | 0.0 /100 | #321 | Tragic 3.12 |
| Immigrants | Canada | 0.0 /100 | #322 | Tragic 3.12 |
| Soviet Union | 0.0 /100 | #323 | Tragic 3.11 |
| Celtics | 0.0 /100 | #324 | Tragic 3.11 |
| English | 0.0 /100 | #325 | Tragic 3.11 |
| Ottawa | 0.0 /100 | #326 | Tragic 3.11 |
| Dutch | 0.0 /100 | #327 | Tragic 3.11 |
| Czechs | 0.0 /100 | #328 | Tragic 3.11 |
| Belgians | 0.0 /100 | #329 | Tragic 3.11 |
| Latvians | 0.0 /100 | #330 | Tragic 3.11 |
| Scotch-Irish | 0.0 /100 | #331 | Tragic 3.11 |
| Scottish | 0.0 /100 | #332 | Tragic 3.11 |
| Estonians | 0.0 /100 | #333 | Tragic 3.10 |
| Lithuanians | 0.0 /100 | #334 | Tragic 3.10 |
| Luxembourgers | 0.0 /100 | #335 | Tragic 3.10 |
Demographics Similar to Seminole by Average Family Size
In terms of average family size, the demographic groups most similar to Seminole are Immigrants from Taiwan (3.24, a difference of 0.0%), Immigrants from Uzbekistan (3.24, a difference of 0.020%), Immigrants from Egypt (3.24, a difference of 0.040%), Immigrants from Eritrea (3.24, a difference of 0.070%), and Iraqi (3.24, a difference of 0.080%).
| Demographics | Rating | Rank | Average Family Size |
| Blackfeet | 75.0 /100 | #148 | Good 3.24 |
| Assyrians/Chaldeans/Syriacs | 73.8 /100 | #149 | Good 3.24 |
| Indians (Asian) | 73.6 /100 | #150 | Good 3.24 |
| Jordanians | 73.5 /100 | #151 | Good 3.24 |
| Spanish Americans | 72.5 /100 | #152 | Good 3.24 |
| Immigrants | Eritrea | 71.4 /100 | #153 | Good 3.24 |
| Immigrants | Egypt | 70.0 /100 | #154 | Good 3.24 |
| Seminole | 68.2 /100 | #155 | Good 3.24 |
| Immigrants | Taiwan | 68.1 /100 | #156 | Good 3.24 |
| Immigrants | Uzbekistan | 67.0 /100 | #157 | Good 3.24 |
| Iraqis | 64.3 /100 | #158 | Good 3.24 |
| Ethiopians | 63.9 /100 | #159 | Good 3.24 |
| Immigrants | Iraq | 63.7 /100 | #160 | Good 3.24 |
| Immigrants | Chile | 63.2 /100 | #161 | Good 3.24 |
| Immigrants | Uganda | 60.1 /100 | #162 | Good 3.23 |