Czech vs Immigrants from Venezuela Average Family Size
COMPARE
Czech
Immigrants from Venezuela
Average Family Size
Average Family Size Comparison
Czechs
Immigrants from Venezuela
3.11
AVERAGE FAMILY SIZE
0.0/ 100
METRIC RATING
328th/ 347
METRIC RANK
3.26
AVERAGE FAMILY SIZE
86.3/ 100
METRIC RATING
133rd/ 347
METRIC RANK
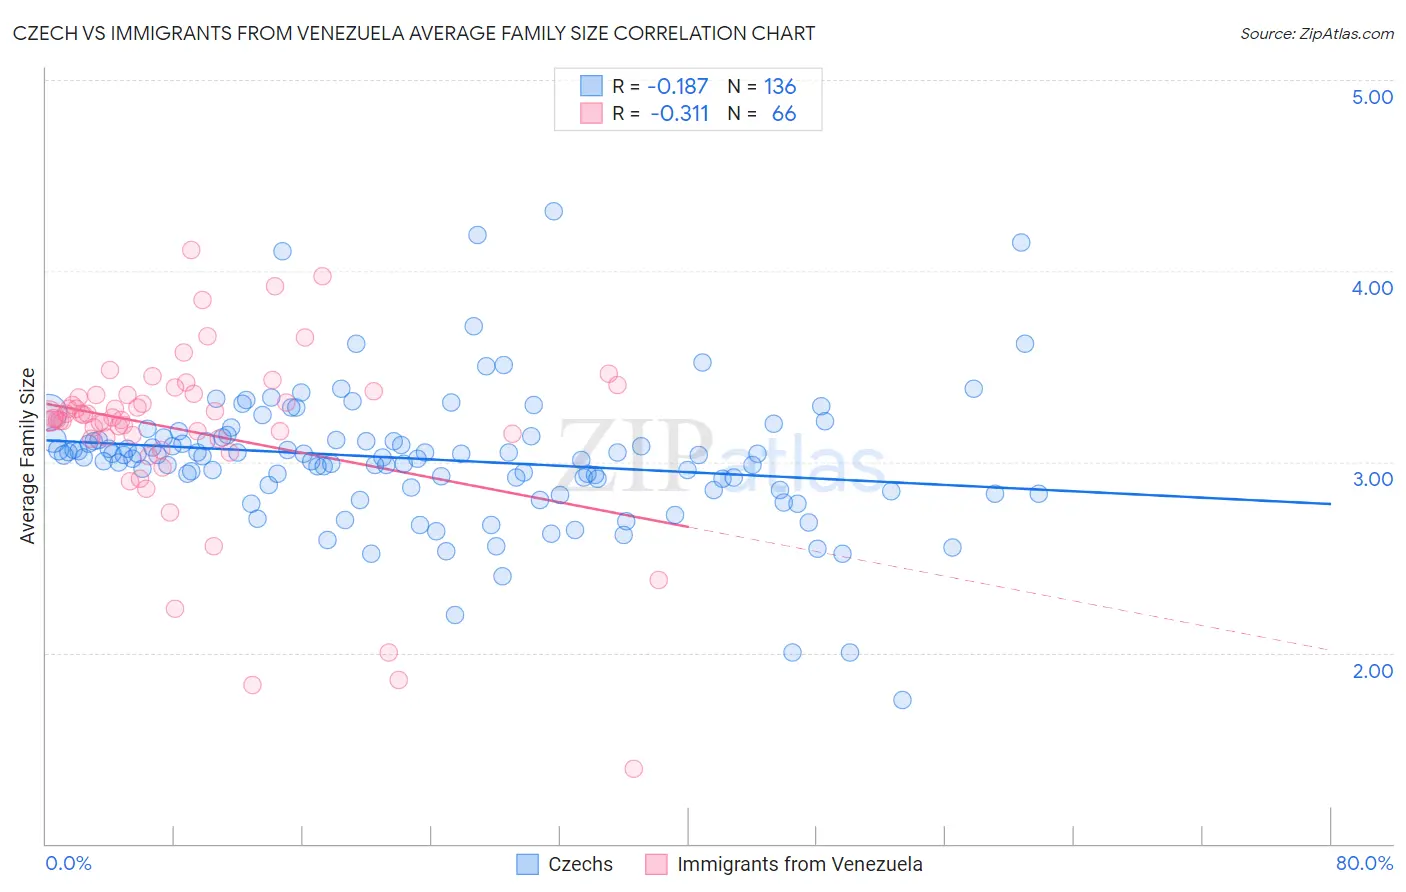
Czech vs Immigrants from Venezuela Average Family Size Correlation Chart
The statistical analysis conducted on geographies consisting of 484,474,906 people shows a poor negative correlation between the proportion of Czechs and average family size in the United States with a correlation coefficient (R) of -0.187 and weighted average of 3.11. Similarly, the statistical analysis conducted on geographies consisting of 287,786,704 people shows a mild negative correlation between the proportion of Immigrants from Venezuela and average family size in the United States with a correlation coefficient (R) of -0.311 and weighted average of 3.26, a difference of 4.7%.
Average Family Size Correlation Summary
| Measurement | Czech | Immigrants from Venezuela |
| Minimum | 1.75 | 1.39 |
| Maximum | 4.31 | 4.11 |
| Range | 2.56 | 2.72 |
| Mean | 3.01 | 3.16 |
| Median | 3.03 | 3.23 |
| Interquartile 25% (IQ1) | 2.86 | 3.12 |
| Interquartile 75% (IQ3) | 3.12 | 3.35 |
| Interquartile Range (IQR) | 0.26 | 0.23 |
| Standard Deviation (Sample) | 0.36 | 0.47 |
| Standard Deviation (Population) | 0.36 | 0.47 |
Similar Demographics by Average Family Size
Demographics Similar to Czechs by Average Family Size
In terms of average family size, the demographic groups most similar to Czechs are Dutch (3.11, a difference of 0.0%), Ottawa (3.11, a difference of 0.010%), English (3.11, a difference of 0.060%), Belgian (3.11, a difference of 0.060%), and Celtic (3.11, a difference of 0.10%).
| Demographics | Rating | Rank | Average Family Size |
| Immigrants | Austria | 0.0 /100 | #321 | Tragic 3.12 |
| Immigrants | Canada | 0.0 /100 | #322 | Tragic 3.12 |
| Soviet Union | 0.0 /100 | #323 | Tragic 3.11 |
| Celtics | 0.0 /100 | #324 | Tragic 3.11 |
| English | 0.0 /100 | #325 | Tragic 3.11 |
| Ottawa | 0.0 /100 | #326 | Tragic 3.11 |
| Dutch | 0.0 /100 | #327 | Tragic 3.11 |
| Czechs | 0.0 /100 | #328 | Tragic 3.11 |
| Belgians | 0.0 /100 | #329 | Tragic 3.11 |
| Latvians | 0.0 /100 | #330 | Tragic 3.11 |
| Scotch-Irish | 0.0 /100 | #331 | Tragic 3.11 |
| Scottish | 0.0 /100 | #332 | Tragic 3.11 |
| Estonians | 0.0 /100 | #333 | Tragic 3.10 |
| Lithuanians | 0.0 /100 | #334 | Tragic 3.10 |
| Luxembourgers | 0.0 /100 | #335 | Tragic 3.10 |
Demographics Similar to Immigrants from Venezuela by Average Family Size
In terms of average family size, the demographic groups most similar to Immigrants from Venezuela are Costa Rican (3.26, a difference of 0.020%), African (3.25, a difference of 0.050%), Immigrants from Western Asia (3.26, a difference of 0.060%), Panamanian (3.25, a difference of 0.070%), and Laotian (3.26, a difference of 0.090%).
| Demographics | Rating | Rank | Average Family Size |
| Immigrants | Costa Rica | 90.7 /100 | #126 | Exceptional 3.26 |
| Immigrants | Syria | 90.6 /100 | #127 | Exceptional 3.26 |
| Colombians | 89.9 /100 | #128 | Excellent 3.26 |
| Immigrants | Hong Kong | 88.6 /100 | #129 | Excellent 3.26 |
| Laotians | 88.5 /100 | #130 | Excellent 3.26 |
| Immigrants | Western Asia | 87.7 /100 | #131 | Excellent 3.26 |
| Costa Ricans | 86.8 /100 | #132 | Excellent 3.26 |
| Immigrants | Venezuela | 86.3 /100 | #133 | Excellent 3.26 |
| Africans | 84.9 /100 | #134 | Excellent 3.25 |
| Panamanians | 84.2 /100 | #135 | Excellent 3.25 |
| Comanche | 82.8 /100 | #136 | Excellent 3.25 |
| Immigrants | Middle Africa | 82.4 /100 | #137 | Excellent 3.25 |
| Cubans | 81.8 /100 | #138 | Excellent 3.25 |
| Immigrants | Ethiopia | 81.6 /100 | #139 | Excellent 3.25 |
| Sub-Saharan Africans | 81.6 /100 | #140 | Excellent 3.25 |