Czech vs Somali Average Family Size
COMPARE
Czech
Somali
Average Family Size
Average Family Size Comparison
Czechs
Somalis
3.11
AVERAGE FAMILY SIZE
0.0/ 100
METRIC RATING
328th/ 347
METRIC RANK
3.20
AVERAGE FAMILY SIZE
11.2/ 100
METRIC RATING
214th/ 347
METRIC RANK
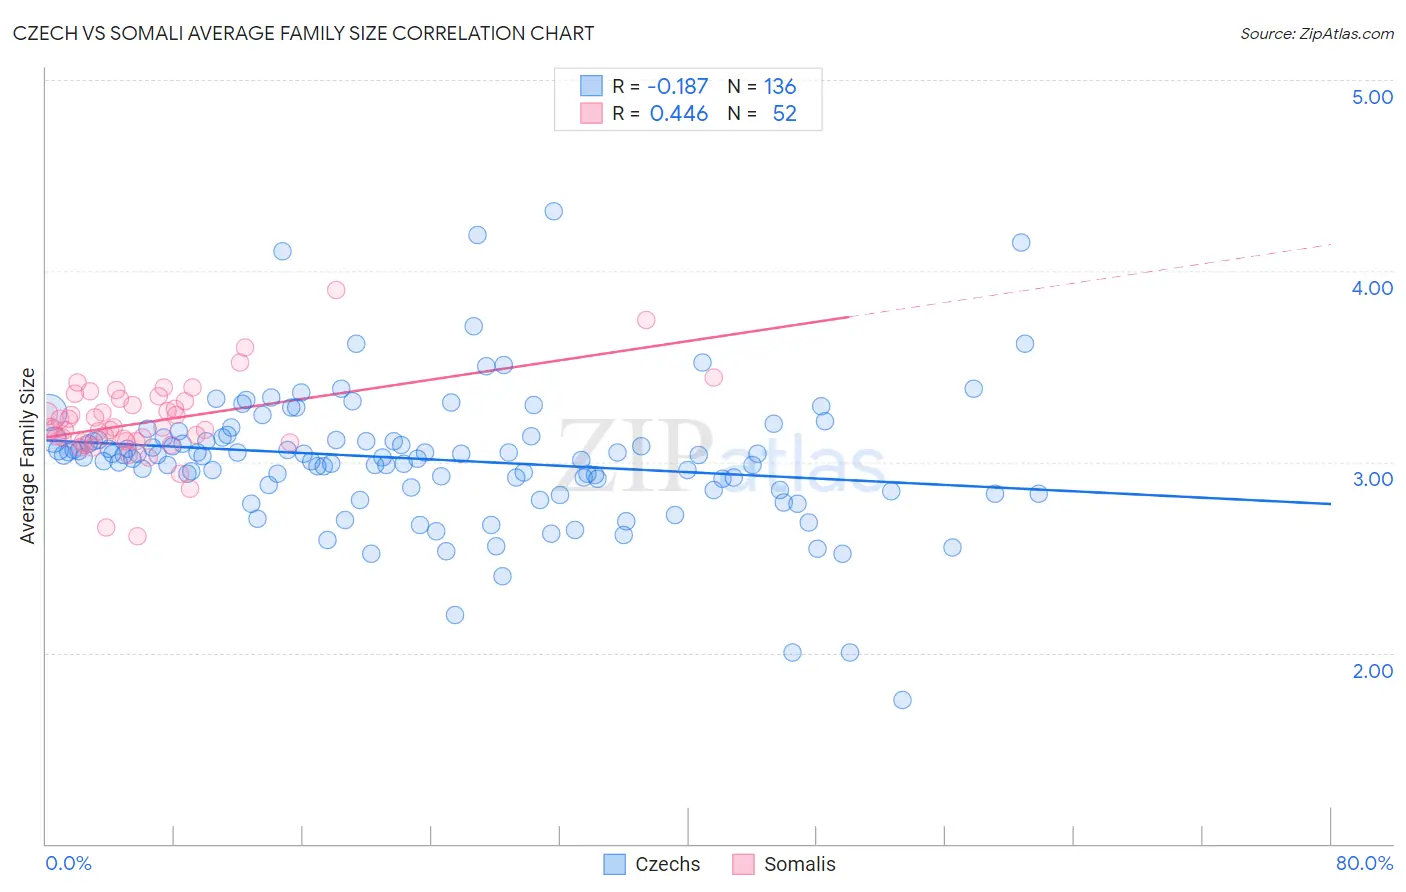
Czech vs Somali Average Family Size Correlation Chart
The statistical analysis conducted on geographies consisting of 484,474,906 people shows a poor negative correlation between the proportion of Czechs and average family size in the United States with a correlation coefficient (R) of -0.187 and weighted average of 3.11. Similarly, the statistical analysis conducted on geographies consisting of 99,260,153 people shows a moderate positive correlation between the proportion of Somalis and average family size in the United States with a correlation coefficient (R) of 0.446 and weighted average of 3.20, a difference of 2.9%.
Average Family Size Correlation Summary
| Measurement | Czech | Somali |
| Minimum | 1.75 | 2.61 |
| Maximum | 4.31 | 3.90 |
| Range | 2.56 | 1.29 |
| Mean | 3.01 | 3.21 |
| Median | 3.03 | 3.18 |
| Interquartile 25% (IQ1) | 2.86 | 3.11 |
| Interquartile 75% (IQ3) | 3.12 | 3.32 |
| Interquartile Range (IQR) | 0.26 | 0.21 |
| Standard Deviation (Sample) | 0.36 | 0.22 |
| Standard Deviation (Population) | 0.36 | 0.21 |
Similar Demographics by Average Family Size
Demographics Similar to Czechs by Average Family Size
In terms of average family size, the demographic groups most similar to Czechs are Dutch (3.11, a difference of 0.0%), Ottawa (3.11, a difference of 0.010%), English (3.11, a difference of 0.060%), Belgian (3.11, a difference of 0.060%), and Celtic (3.11, a difference of 0.10%).
| Demographics | Rating | Rank | Average Family Size |
| Immigrants | Austria | 0.0 /100 | #321 | Tragic 3.12 |
| Immigrants | Canada | 0.0 /100 | #322 | Tragic 3.12 |
| Soviet Union | 0.0 /100 | #323 | Tragic 3.11 |
| Celtics | 0.0 /100 | #324 | Tragic 3.11 |
| English | 0.0 /100 | #325 | Tragic 3.11 |
| Ottawa | 0.0 /100 | #326 | Tragic 3.11 |
| Dutch | 0.0 /100 | #327 | Tragic 3.11 |
| Czechs | 0.0 /100 | #328 | Tragic 3.11 |
| Belgians | 0.0 /100 | #329 | Tragic 3.11 |
| Latvians | 0.0 /100 | #330 | Tragic 3.11 |
| Scotch-Irish | 0.0 /100 | #331 | Tragic 3.11 |
| Scottish | 0.0 /100 | #332 | Tragic 3.11 |
| Estonians | 0.0 /100 | #333 | Tragic 3.10 |
| Lithuanians | 0.0 /100 | #334 | Tragic 3.10 |
| Luxembourgers | 0.0 /100 | #335 | Tragic 3.10 |
Demographics Similar to Somalis by Average Family Size
In terms of average family size, the demographic groups most similar to Somalis are Delaware (3.20, a difference of 0.010%), Bermudan (3.20, a difference of 0.010%), Mongolian (3.20, a difference of 0.020%), Immigrants from Iran (3.20, a difference of 0.040%), and Creek (3.20, a difference of 0.040%).
| Demographics | Rating | Rank | Average Family Size |
| Filipinos | 13.6 /100 | #207 | Poor 3.20 |
| Chippewa | 13.3 /100 | #208 | Poor 3.20 |
| Sudanese | 13.3 /100 | #209 | Poor 3.20 |
| Zimbabweans | 12.6 /100 | #210 | Poor 3.20 |
| Immigrants | Iran | 12.1 /100 | #211 | Poor 3.20 |
| Creek | 12.1 /100 | #212 | Poor 3.20 |
| Mongolians | 11.5 /100 | #213 | Poor 3.20 |
| Somalis | 11.2 /100 | #214 | Poor 3.20 |
| Delaware | 11.1 /100 | #215 | Poor 3.20 |
| Bermudans | 11.0 /100 | #216 | Poor 3.20 |
| Immigrants | Somalia | 10.3 /100 | #217 | Poor 3.20 |
| French American Indians | 9.8 /100 | #218 | Tragic 3.20 |
| Pennsylvania Germans | 9.3 /100 | #219 | Tragic 3.19 |
| Lebanese | 9.1 /100 | #220 | Tragic 3.19 |
| Immigrants | Ukraine | 7.2 /100 | #221 | Tragic 3.19 |