Czech vs Immigrants from Bolivia Average Family Size
COMPARE
Czech
Immigrants from Bolivia
Average Family Size
Average Family Size Comparison
Czechs
Immigrants from Bolivia
3.11
AVERAGE FAMILY SIZE
0.0/ 100
METRIC RATING
328th/ 347
METRIC RANK
3.31
AVERAGE FAMILY SIZE
99.6/ 100
METRIC RATING
88th/ 347
METRIC RANK
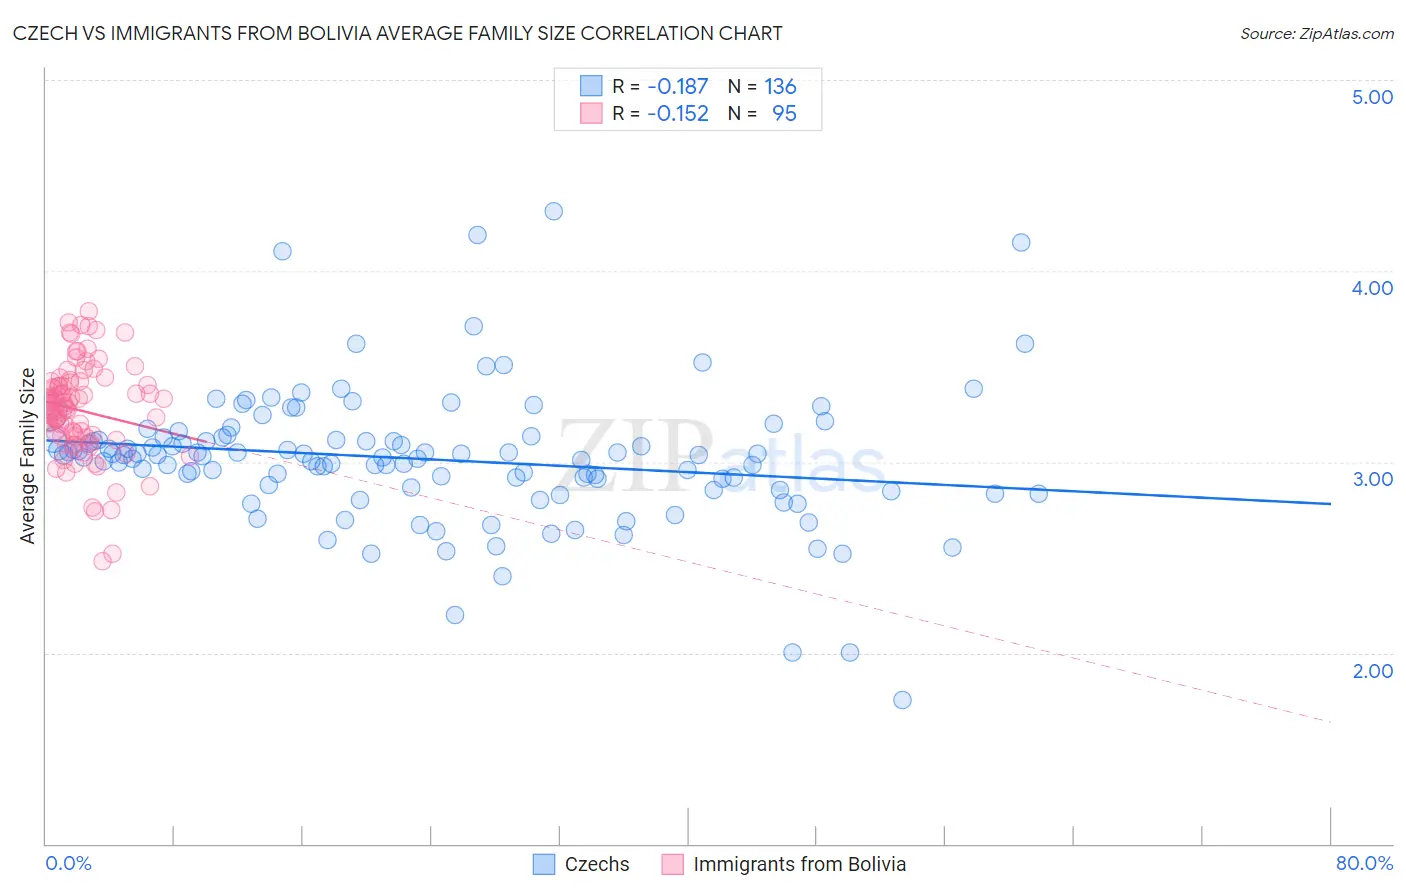
Czech vs Immigrants from Bolivia Average Family Size Correlation Chart
The statistical analysis conducted on geographies consisting of 484,474,906 people shows a poor negative correlation between the proportion of Czechs and average family size in the United States with a correlation coefficient (R) of -0.187 and weighted average of 3.11. Similarly, the statistical analysis conducted on geographies consisting of 158,712,617 people shows a poor negative correlation between the proportion of Immigrants from Bolivia and average family size in the United States with a correlation coefficient (R) of -0.152 and weighted average of 3.31, a difference of 6.4%.
Average Family Size Correlation Summary
| Measurement | Czech | Immigrants from Bolivia |
| Minimum | 1.75 | 2.48 |
| Maximum | 4.31 | 3.79 |
| Range | 2.56 | 1.31 |
| Mean | 3.01 | 3.27 |
| Median | 3.03 | 3.29 |
| Interquartile 25% (IQ1) | 2.86 | 3.13 |
| Interquartile 75% (IQ3) | 3.12 | 3.42 |
| Interquartile Range (IQR) | 0.26 | 0.28 |
| Standard Deviation (Sample) | 0.36 | 0.25 |
| Standard Deviation (Population) | 0.36 | 0.25 |
Similar Demographics by Average Family Size
Demographics Similar to Czechs by Average Family Size
In terms of average family size, the demographic groups most similar to Czechs are Dutch (3.11, a difference of 0.0%), Ottawa (3.11, a difference of 0.010%), English (3.11, a difference of 0.060%), Belgian (3.11, a difference of 0.060%), and Celtic (3.11, a difference of 0.10%).
| Demographics | Rating | Rank | Average Family Size |
| Immigrants | Austria | 0.0 /100 | #321 | Tragic 3.12 |
| Immigrants | Canada | 0.0 /100 | #322 | Tragic 3.12 |
| Soviet Union | 0.0 /100 | #323 | Tragic 3.11 |
| Celtics | 0.0 /100 | #324 | Tragic 3.11 |
| English | 0.0 /100 | #325 | Tragic 3.11 |
| Ottawa | 0.0 /100 | #326 | Tragic 3.11 |
| Dutch | 0.0 /100 | #327 | Tragic 3.11 |
| Czechs | 0.0 /100 | #328 | Tragic 3.11 |
| Belgians | 0.0 /100 | #329 | Tragic 3.11 |
| Latvians | 0.0 /100 | #330 | Tragic 3.11 |
| Scotch-Irish | 0.0 /100 | #331 | Tragic 3.11 |
| Scottish | 0.0 /100 | #332 | Tragic 3.11 |
| Estonians | 0.0 /100 | #333 | Tragic 3.10 |
| Lithuanians | 0.0 /100 | #334 | Tragic 3.10 |
| Luxembourgers | 0.0 /100 | #335 | Tragic 3.10 |
Demographics Similar to Immigrants from Bolivia by Average Family Size
In terms of average family size, the demographic groups most similar to Immigrants from Bolivia are Malaysian (3.31, a difference of 0.010%), Immigrants from Peru (3.31, a difference of 0.090%), Menominee (3.30, a difference of 0.12%), Jamaican (3.31, a difference of 0.14%), and Afghan (3.31, a difference of 0.16%).
| Demographics | Rating | Rank | Average Family Size |
| Immigrants | Dominica | 99.8 /100 | #81 | Exceptional 3.32 |
| Ecuadorians | 99.8 /100 | #82 | Exceptional 3.32 |
| Immigrants | Afghanistan | 99.8 /100 | #83 | Exceptional 3.32 |
| Immigrants | Nigeria | 99.7 /100 | #84 | Exceptional 3.32 |
| Afghans | 99.7 /100 | #85 | Exceptional 3.31 |
| Jamaicans | 99.7 /100 | #86 | Exceptional 3.31 |
| Immigrants | Peru | 99.7 /100 | #87 | Exceptional 3.31 |
| Immigrants | Bolivia | 99.6 /100 | #88 | Exceptional 3.31 |
| Malaysians | 99.6 /100 | #89 | Exceptional 3.31 |
| Menominee | 99.4 /100 | #90 | Exceptional 3.30 |
| Immigrants | Pakistan | 99.2 /100 | #91 | Exceptional 3.30 |
| Immigrants | Cameroon | 99.2 /100 | #92 | Exceptional 3.30 |
| Peruvians | 99.2 /100 | #93 | Exceptional 3.30 |
| Sierra Leoneans | 99.0 /100 | #94 | Exceptional 3.30 |
| Immigrants | Lebanon | 99.0 /100 | #95 | Exceptional 3.30 |