Czech vs Immigrants from Colombia Average Family Size
COMPARE
Czech
Immigrants from Colombia
Average Family Size
Average Family Size Comparison
Czechs
Immigrants from Colombia
3.11
AVERAGE FAMILY SIZE
0.0/ 100
METRIC RATING
328th/ 347
METRIC RANK
3.27
AVERAGE FAMILY SIZE
92.8/ 100
METRIC RATING
122nd/ 347
METRIC RANK
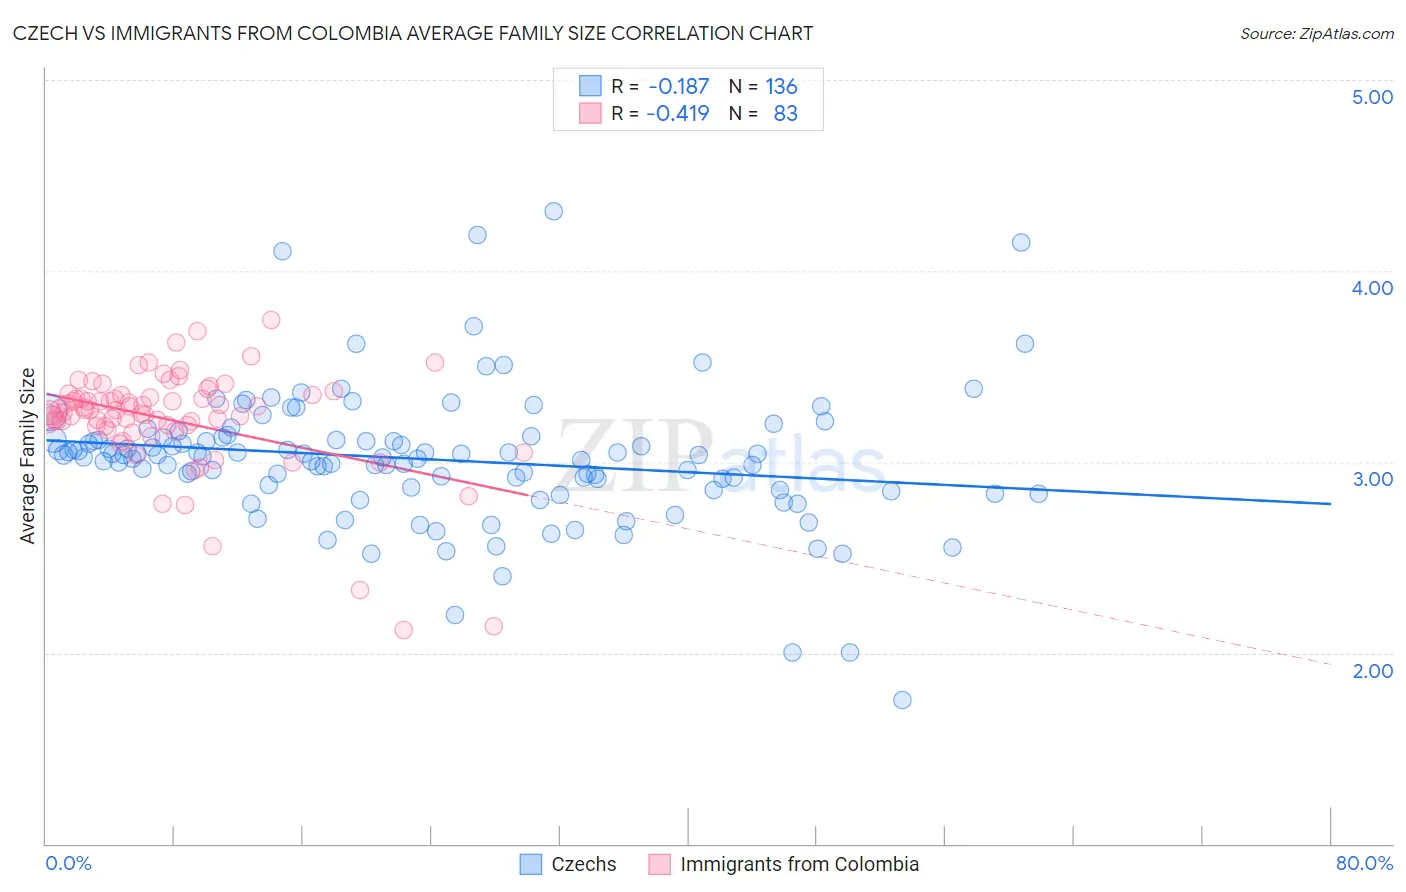
Czech vs Immigrants from Colombia Average Family Size Correlation Chart
The statistical analysis conducted on geographies consisting of 484,474,906 people shows a poor negative correlation between the proportion of Czechs and average family size in the United States with a correlation coefficient (R) of -0.187 and weighted average of 3.11. Similarly, the statistical analysis conducted on geographies consisting of 378,535,546 people shows a moderate negative correlation between the proportion of Immigrants from Colombia and average family size in the United States with a correlation coefficient (R) of -0.419 and weighted average of 3.27, a difference of 5.1%.
Average Family Size Correlation Summary
| Measurement | Czech | Immigrants from Colombia |
| Minimum | 1.75 | 2.12 |
| Maximum | 4.31 | 3.74 |
| Range | 2.56 | 1.62 |
| Mean | 3.01 | 3.22 |
| Median | 3.03 | 3.27 |
| Interquartile 25% (IQ1) | 2.86 | 3.18 |
| Interquartile 75% (IQ3) | 3.12 | 3.35 |
| Interquartile Range (IQR) | 0.26 | 0.17 |
| Standard Deviation (Sample) | 0.36 | 0.28 |
| Standard Deviation (Population) | 0.36 | 0.27 |
Similar Demographics by Average Family Size
Demographics Similar to Czechs by Average Family Size
In terms of average family size, the demographic groups most similar to Czechs are Dutch (3.11, a difference of 0.0%), Ottawa (3.11, a difference of 0.010%), English (3.11, a difference of 0.060%), Belgian (3.11, a difference of 0.060%), and Celtic (3.11, a difference of 0.10%).
| Demographics | Rating | Rank | Average Family Size |
| Immigrants | Austria | 0.0 /100 | #321 | Tragic 3.12 |
| Immigrants | Canada | 0.0 /100 | #322 | Tragic 3.12 |
| Soviet Union | 0.0 /100 | #323 | Tragic 3.11 |
| Celtics | 0.0 /100 | #324 | Tragic 3.11 |
| English | 0.0 /100 | #325 | Tragic 3.11 |
| Ottawa | 0.0 /100 | #326 | Tragic 3.11 |
| Dutch | 0.0 /100 | #327 | Tragic 3.11 |
| Czechs | 0.0 /100 | #328 | Tragic 3.11 |
| Belgians | 0.0 /100 | #329 | Tragic 3.11 |
| Latvians | 0.0 /100 | #330 | Tragic 3.11 |
| Scotch-Irish | 0.0 /100 | #331 | Tragic 3.11 |
| Scottish | 0.0 /100 | #332 | Tragic 3.11 |
| Estonians | 0.0 /100 | #333 | Tragic 3.10 |
| Lithuanians | 0.0 /100 | #334 | Tragic 3.10 |
| Luxembourgers | 0.0 /100 | #335 | Tragic 3.10 |
Demographics Similar to Immigrants from Colombia by Average Family Size
In terms of average family size, the demographic groups most similar to Immigrants from Colombia are Alaskan Athabascan (3.27, a difference of 0.020%), Immigrants from Thailand (3.27, a difference of 0.030%), Immigrants from Bahamas (3.27, a difference of 0.060%), Immigrants from Indonesia (3.27, a difference of 0.070%), and South American Indian (3.26, a difference of 0.070%).
| Demographics | Rating | Rank | Average Family Size |
| Immigrants | Liberia | 95.0 /100 | #115 | Exceptional 3.27 |
| Immigrants | South America | 95.0 /100 | #116 | Exceptional 3.27 |
| Kiowa | 94.8 /100 | #117 | Exceptional 3.27 |
| Immigrants | Asia | 94.0 /100 | #118 | Exceptional 3.27 |
| Immigrants | Indonesia | 93.7 /100 | #119 | Exceptional 3.27 |
| Immigrants | Bahamas | 93.6 /100 | #120 | Exceptional 3.27 |
| Immigrants | Thailand | 93.3 /100 | #121 | Exceptional 3.27 |
| Immigrants | Colombia | 92.8 /100 | #122 | Exceptional 3.27 |
| Alaskan Athabascans | 92.4 /100 | #123 | Exceptional 3.27 |
| South American Indians | 91.6 /100 | #124 | Exceptional 3.26 |
| Immigrants | Cuba | 91.3 /100 | #125 | Exceptional 3.26 |
| Immigrants | Costa Rica | 90.7 /100 | #126 | Exceptional 3.26 |
| Immigrants | Syria | 90.6 /100 | #127 | Exceptional 3.26 |
| Colombians | 89.9 /100 | #128 | Excellent 3.26 |
| Immigrants | Hong Kong | 88.6 /100 | #129 | Excellent 3.26 |