Czech vs Mexican American Indian Average Family Size
COMPARE
Czech
Mexican American Indian
Average Family Size
Average Family Size Comparison
Czechs
Mexican American Indians
3.11
AVERAGE FAMILY SIZE
0.0/ 100
METRIC RATING
328th/ 347
METRIC RANK
3.43
AVERAGE FAMILY SIZE
100.0/ 100
METRIC RATING
27th/ 347
METRIC RANK
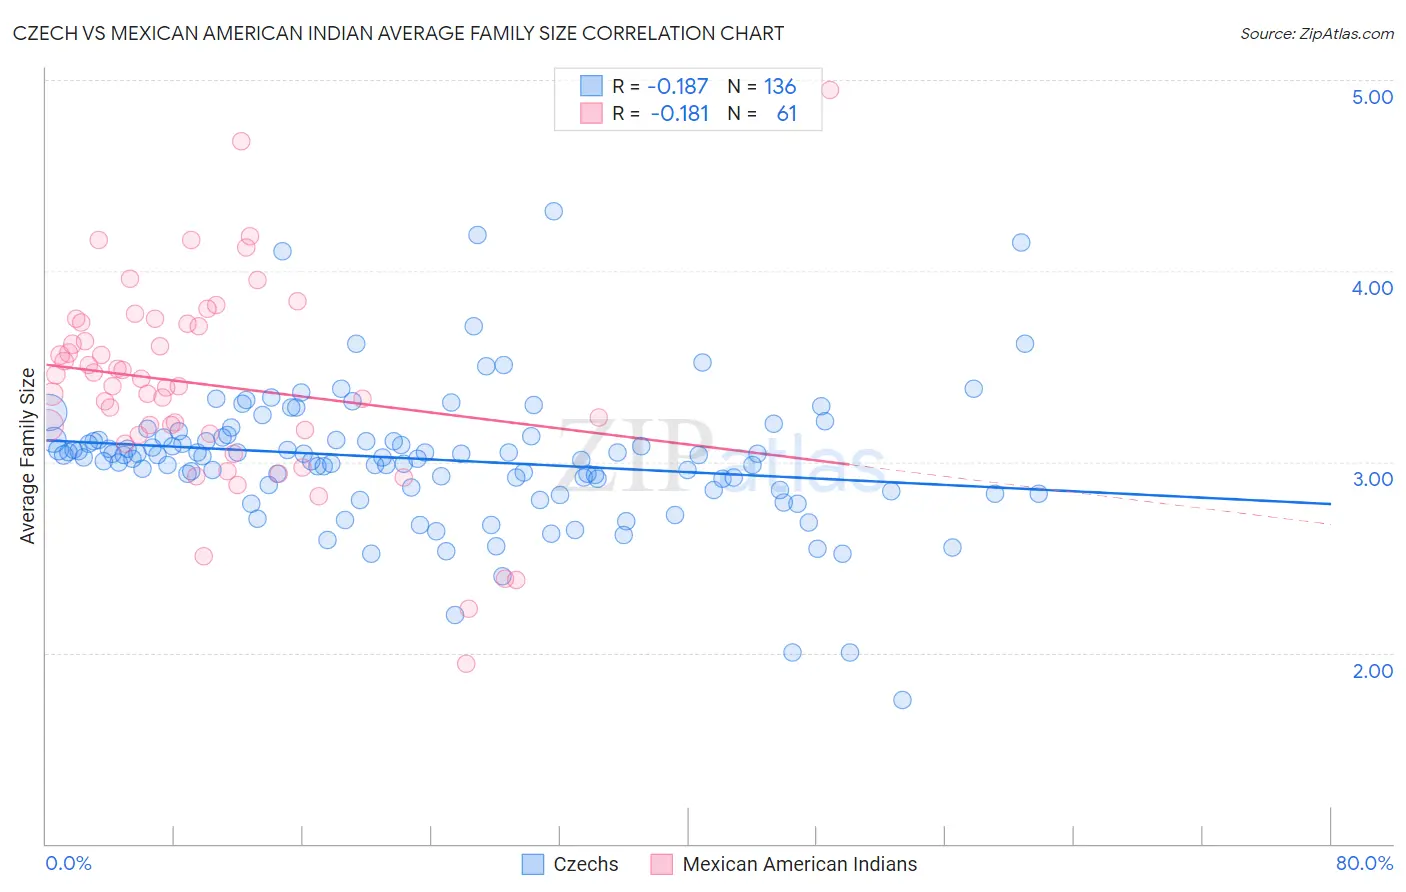
Czech vs Mexican American Indian Average Family Size Correlation Chart
The statistical analysis conducted on geographies consisting of 484,474,906 people shows a poor negative correlation between the proportion of Czechs and average family size in the United States with a correlation coefficient (R) of -0.187 and weighted average of 3.11. Similarly, the statistical analysis conducted on geographies consisting of 317,496,069 people shows a poor negative correlation between the proportion of Mexican American Indians and average family size in the United States with a correlation coefficient (R) of -0.181 and weighted average of 3.43, a difference of 10.3%.
Average Family Size Correlation Summary
| Measurement | Czech | Mexican American Indian |
| Minimum | 1.75 | 1.94 |
| Maximum | 4.31 | 4.95 |
| Range | 2.56 | 3.01 |
| Mean | 3.01 | 3.40 |
| Median | 3.03 | 3.40 |
| Interquartile 25% (IQ1) | 2.86 | 3.15 |
| Interquartile 75% (IQ3) | 3.12 | 3.73 |
| Interquartile Range (IQR) | 0.26 | 0.58 |
| Standard Deviation (Sample) | 0.36 | 0.53 |
| Standard Deviation (Population) | 0.36 | 0.53 |
Similar Demographics by Average Family Size
Demographics Similar to Czechs by Average Family Size
In terms of average family size, the demographic groups most similar to Czechs are Dutch (3.11, a difference of 0.0%), Ottawa (3.11, a difference of 0.010%), English (3.11, a difference of 0.060%), Belgian (3.11, a difference of 0.060%), and Celtic (3.11, a difference of 0.10%).
| Demographics | Rating | Rank | Average Family Size |
| Immigrants | Austria | 0.0 /100 | #321 | Tragic 3.12 |
| Immigrants | Canada | 0.0 /100 | #322 | Tragic 3.12 |
| Soviet Union | 0.0 /100 | #323 | Tragic 3.11 |
| Celtics | 0.0 /100 | #324 | Tragic 3.11 |
| English | 0.0 /100 | #325 | Tragic 3.11 |
| Ottawa | 0.0 /100 | #326 | Tragic 3.11 |
| Dutch | 0.0 /100 | #327 | Tragic 3.11 |
| Czechs | 0.0 /100 | #328 | Tragic 3.11 |
| Belgians | 0.0 /100 | #329 | Tragic 3.11 |
| Latvians | 0.0 /100 | #330 | Tragic 3.11 |
| Scotch-Irish | 0.0 /100 | #331 | Tragic 3.11 |
| Scottish | 0.0 /100 | #332 | Tragic 3.11 |
| Estonians | 0.0 /100 | #333 | Tragic 3.10 |
| Lithuanians | 0.0 /100 | #334 | Tragic 3.10 |
| Luxembourgers | 0.0 /100 | #335 | Tragic 3.10 |
Demographics Similar to Mexican American Indians by Average Family Size
In terms of average family size, the demographic groups most similar to Mexican American Indians are Native Hawaiian (3.43, a difference of 0.010%), Immigrants from Latin America (3.42, a difference of 0.12%), Nepalese (3.42, a difference of 0.21%), Samoan (3.42, a difference of 0.24%), and Central American (3.41, a difference of 0.44%).
| Demographics | Rating | Rank | Average Family Size |
| Cheyenne | 100.0 /100 | #20 | Exceptional 3.47 |
| Yuman | 100.0 /100 | #21 | Exceptional 3.47 |
| Apache | 100.0 /100 | #22 | Exceptional 3.46 |
| Immigrants | Fiji | 100.0 /100 | #23 | Exceptional 3.45 |
| Natives/Alaskans | 100.0 /100 | #24 | Exceptional 3.45 |
| Yakama | 100.0 /100 | #25 | Exceptional 3.45 |
| Native Hawaiians | 100.0 /100 | #26 | Exceptional 3.43 |
| Mexican American Indians | 100.0 /100 | #27 | Exceptional 3.43 |
| Immigrants | Latin America | 100.0 /100 | #28 | Exceptional 3.42 |
| Nepalese | 100.0 /100 | #29 | Exceptional 3.42 |
| Samoans | 100.0 /100 | #30 | Exceptional 3.42 |
| Central Americans | 100.0 /100 | #31 | Exceptional 3.41 |
| Immigrants | Guatemala | 100.0 /100 | #32 | Exceptional 3.41 |
| Hawaiians | 100.0 /100 | #33 | Exceptional 3.41 |
| Hispanics or Latinos | 100.0 /100 | #34 | Exceptional 3.41 |