Jamaican vs Immigrants from Colombia Average Family Size
COMPARE
Jamaican
Immigrants from Colombia
Average Family Size
Average Family Size Comparison
Jamaicans
Immigrants from Colombia
3.31
AVERAGE FAMILY SIZE
99.7/ 100
METRIC RATING
86th/ 347
METRIC RANK
3.27
AVERAGE FAMILY SIZE
92.8/ 100
METRIC RATING
122nd/ 347
METRIC RANK
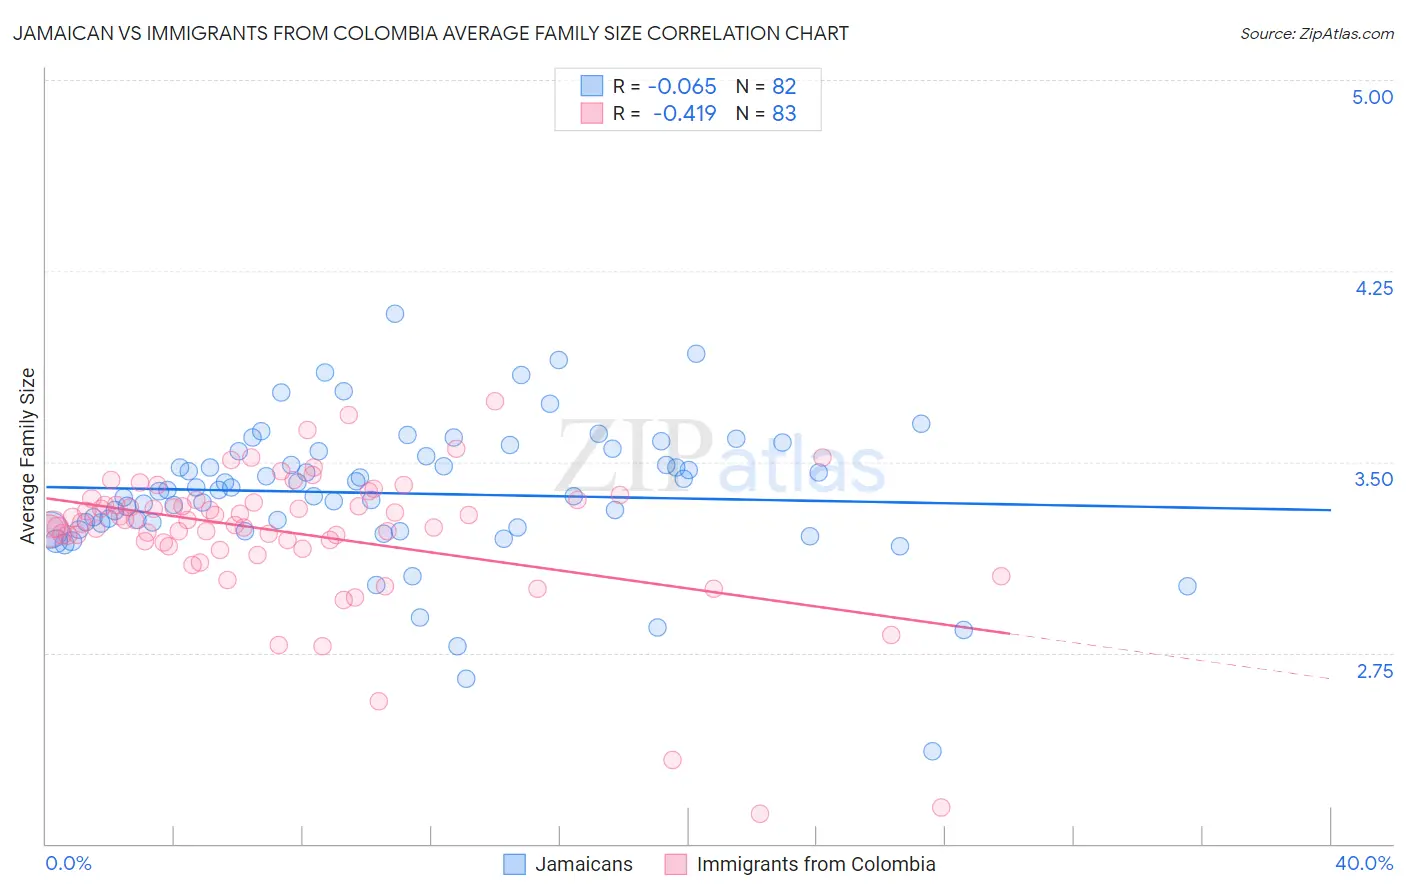
Jamaican vs Immigrants from Colombia Average Family Size Correlation Chart
The statistical analysis conducted on geographies consisting of 367,646,796 people shows a slight negative correlation between the proportion of Jamaicans and average family size in the United States with a correlation coefficient (R) of -0.065 and weighted average of 3.31. Similarly, the statistical analysis conducted on geographies consisting of 378,535,546 people shows a moderate negative correlation between the proportion of Immigrants from Colombia and average family size in the United States with a correlation coefficient (R) of -0.419 and weighted average of 3.27, a difference of 1.5%.
Average Family Size Correlation Summary
| Measurement | Jamaican | Immigrants from Colombia |
| Minimum | 2.36 | 2.12 |
| Maximum | 4.08 | 3.74 |
| Range | 1.72 | 1.62 |
| Mean | 3.38 | 3.22 |
| Median | 3.39 | 3.27 |
| Interquartile 25% (IQ1) | 3.24 | 3.18 |
| Interquartile 75% (IQ3) | 3.54 | 3.35 |
| Interquartile Range (IQR) | 0.30 | 0.17 |
| Standard Deviation (Sample) | 0.28 | 0.28 |
| Standard Deviation (Population) | 0.28 | 0.27 |
Similar Demographics by Average Family Size
Demographics Similar to Jamaicans by Average Family Size
In terms of average family size, the demographic groups most similar to Jamaicans are Afghan (3.31, a difference of 0.020%), Immigrants from Peru (3.31, a difference of 0.050%), Immigrants from Nigeria (3.32, a difference of 0.060%), Immigrants from Afghanistan (3.32, a difference of 0.10%), and Ecuadorian (3.32, a difference of 0.11%).
| Demographics | Rating | Rank | Average Family Size |
| British West Indians | 99.8 /100 | #79 | Exceptional 3.32 |
| Lumbee | 99.8 /100 | #80 | Exceptional 3.32 |
| Immigrants | Dominica | 99.8 /100 | #81 | Exceptional 3.32 |
| Ecuadorians | 99.8 /100 | #82 | Exceptional 3.32 |
| Immigrants | Afghanistan | 99.8 /100 | #83 | Exceptional 3.32 |
| Immigrants | Nigeria | 99.7 /100 | #84 | Exceptional 3.32 |
| Afghans | 99.7 /100 | #85 | Exceptional 3.31 |
| Jamaicans | 99.7 /100 | #86 | Exceptional 3.31 |
| Immigrants | Peru | 99.7 /100 | #87 | Exceptional 3.31 |
| Immigrants | Bolivia | 99.6 /100 | #88 | Exceptional 3.31 |
| Malaysians | 99.6 /100 | #89 | Exceptional 3.31 |
| Menominee | 99.4 /100 | #90 | Exceptional 3.30 |
| Immigrants | Pakistan | 99.2 /100 | #91 | Exceptional 3.30 |
| Immigrants | Cameroon | 99.2 /100 | #92 | Exceptional 3.30 |
| Peruvians | 99.2 /100 | #93 | Exceptional 3.30 |
Demographics Similar to Immigrants from Colombia by Average Family Size
In terms of average family size, the demographic groups most similar to Immigrants from Colombia are Alaskan Athabascan (3.27, a difference of 0.020%), Immigrants from Thailand (3.27, a difference of 0.030%), Immigrants from Bahamas (3.27, a difference of 0.060%), Immigrants from Indonesia (3.27, a difference of 0.070%), and South American Indian (3.26, a difference of 0.070%).
| Demographics | Rating | Rank | Average Family Size |
| Immigrants | Liberia | 95.0 /100 | #115 | Exceptional 3.27 |
| Immigrants | South America | 95.0 /100 | #116 | Exceptional 3.27 |
| Kiowa | 94.8 /100 | #117 | Exceptional 3.27 |
| Immigrants | Asia | 94.0 /100 | #118 | Exceptional 3.27 |
| Immigrants | Indonesia | 93.7 /100 | #119 | Exceptional 3.27 |
| Immigrants | Bahamas | 93.6 /100 | #120 | Exceptional 3.27 |
| Immigrants | Thailand | 93.3 /100 | #121 | Exceptional 3.27 |
| Immigrants | Colombia | 92.8 /100 | #122 | Exceptional 3.27 |
| Alaskan Athabascans | 92.4 /100 | #123 | Exceptional 3.27 |
| South American Indians | 91.6 /100 | #124 | Exceptional 3.26 |
| Immigrants | Cuba | 91.3 /100 | #125 | Exceptional 3.26 |
| Immigrants | Costa Rica | 90.7 /100 | #126 | Exceptional 3.26 |
| Immigrants | Syria | 90.6 /100 | #127 | Exceptional 3.26 |
| Colombians | 89.9 /100 | #128 | Excellent 3.26 |
| Immigrants | Hong Kong | 88.6 /100 | #129 | Excellent 3.26 |